By Chad Walker, CPA – March 5, 2026
A war broke out over the weekend. The United States and Israel launched military operations against Iran on Saturday morning. Markets scrambled. Yields spiked. Risk assets wobbled.
And Bitcoin held.
That single fact – that a genuine geopolitical shock failed to break the $59,600 low from February 3 – might be the most important development since this entire correction began.
Let me explain why.
Where We’ve Been
If you’ve been following along, you know the story. Bitcoin topped at $126,000 in October 2025, exactly when I predicted it would in my December 2023 series of Gann date articles. It then declined over four months to a low of $59,600 on February 3, 2026 – a 52% drawdown that felt like the end of the world for a lot of people.
In my February 10 article, “You Are NOT Prepared,” I laid out two competing views. The bullish view: the decline was a corrective A-B-C wave completing a larger wave 2, and what comes next is a massive wave 3 rally targeting $170,000 or higher. The bearish view: the entire bull market from $15,000 to $126,000 was a completed five-wave cycle, and we’re headed to $28,000 or lower.
I was honest about both possibilities. And I gave you a scorecard – specific, falsifiable criteria for how we’d know which one was playing out.
A month later, it’s time to check that scorecard. Because things have changed.
Checking the Scorecard
Let’s go through what I said we’d be watching, point by point.
I said the most important level was $59,600. If that broke on expanding volume, the bears win. It hasn’t broken. Not only did it hold through the choppy February consolidation, but it held through a WAR. The U.S. bombing Iran is exactly the kind of exogenous shock that should trigger the next leg lower if the bearish count is correct. If you’re a bear and you can’t break a support level when bombs are literally dropping in the Middle East, when exactly do you expect to break it?
I said we needed to see Bitcoin break above $70,000 with conviction. As I write this on March 5, price is at $72,900. Check.
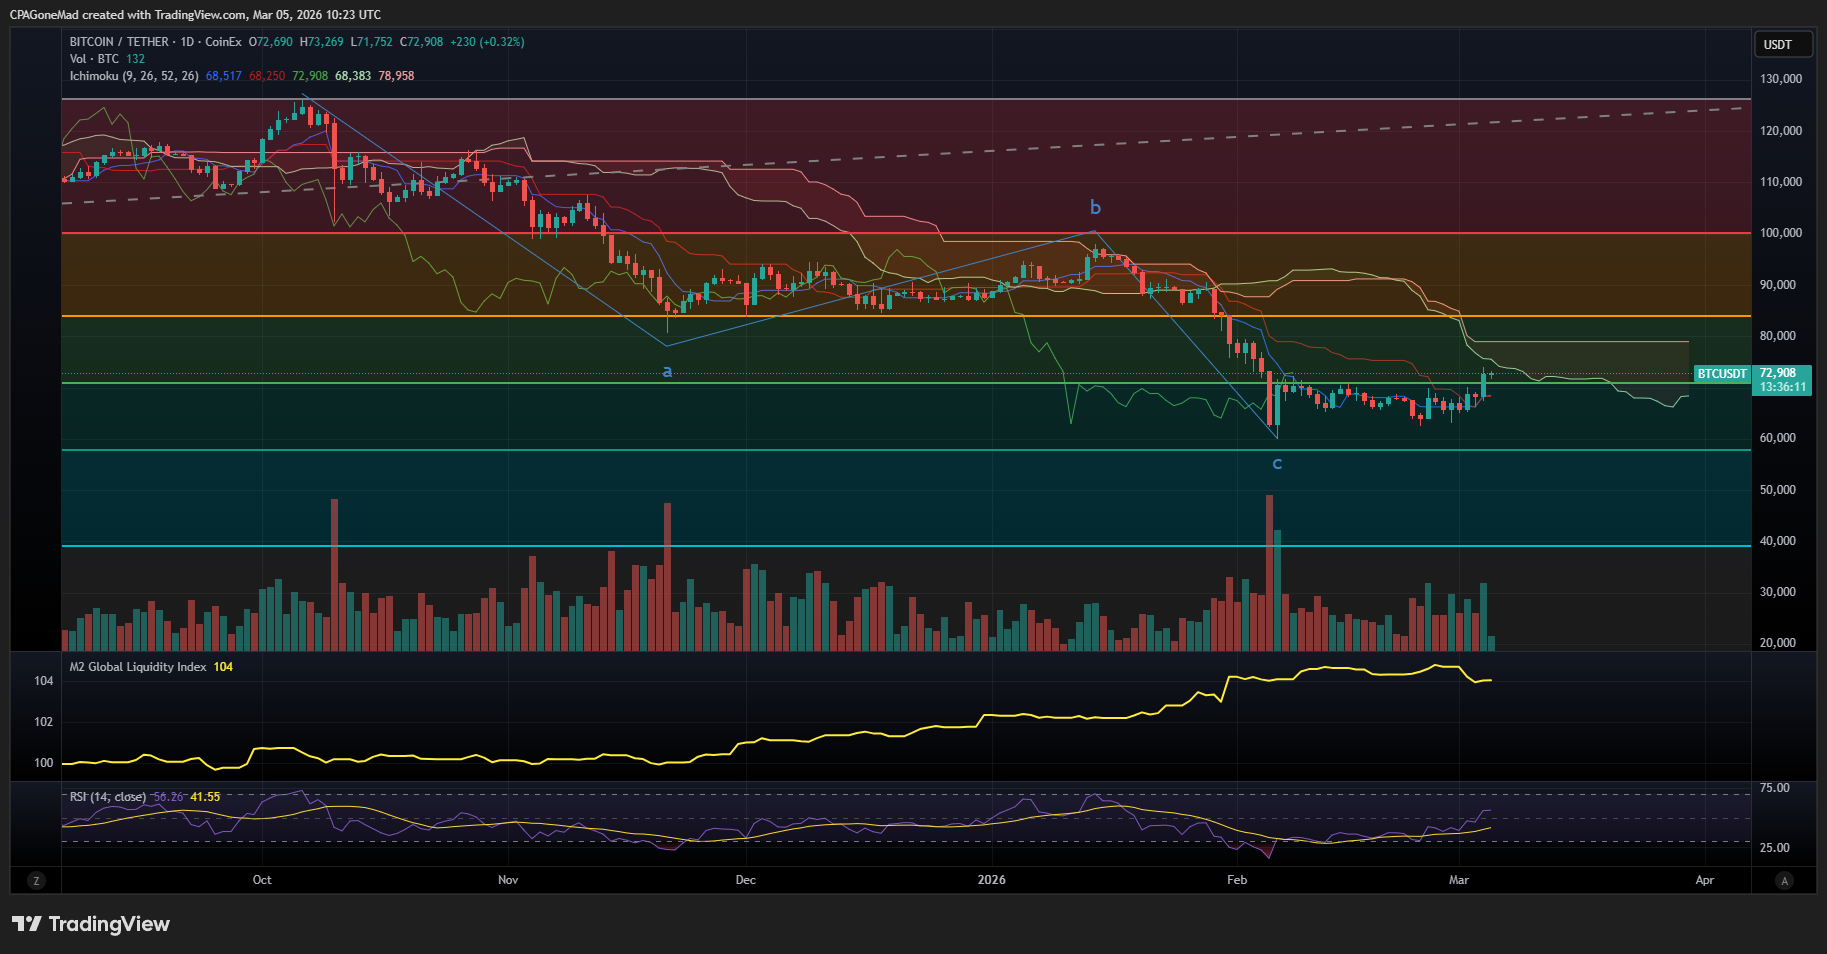
I said we needed to be above the downward-sloping Gann angle by March 10-12. The Gann box geometry on my 4-hour chart shows price has approached and is pressing against the key horizontal and diagonal white lines within the Gann structure that capped every rally for months. This is happening on March 5 – ahead of the March 10-12 window. The Gann geometry suggests this time/price intersection should resolve in the next one to two weeks.
I said the character of the bounce matters – is it impulsive or corrective? This is where I need to be honest. The bounce hasn’t been the clean, obvious, impulsive moonshot I described as the ideal bullish scenario. It’s been a grind. A long, frustrating basing process with a lot of back-and-forth. On the hourly chart, I can count a series of five-wave impulsive moves off the lows, which is technically bullish. But I can also see a lot of nested 1-2’s – and experienced Elliott Wave practitioners know that a series of 1-2’s that never produces the expected third wave acceleration is one of the most common traps in wave analysis. You can force a bullish count onto almost anything if you stack enough 1-2’s.
But here’s the counterpoint: if this actually IS a wave 3 of 3 of 3 setting up, a series of nested 1-2’s is exactly what you’d see before the explosive move. The energy builds through a sequence of setups, each one coiling tighter, until the spring releases all at once. The market has to shake out every last weak hand before the real move begins. And what better way to shake out weak hands than a grinding, frustrating, “this isn’t working” basing process that makes even bulls start to doubt?
I said that breaking above $76,000 – the 0.382 Fibonacci retracement – would be significant confirmation. We haven’t hit that yet. And I said breaking above $81,000 would be strong confirmation. We’re not there either.
The scorecard says: leaning bullish, but not confirmed.
What the Charts Are Saying This Morning
Let me walk you through what matters most on the technical side.
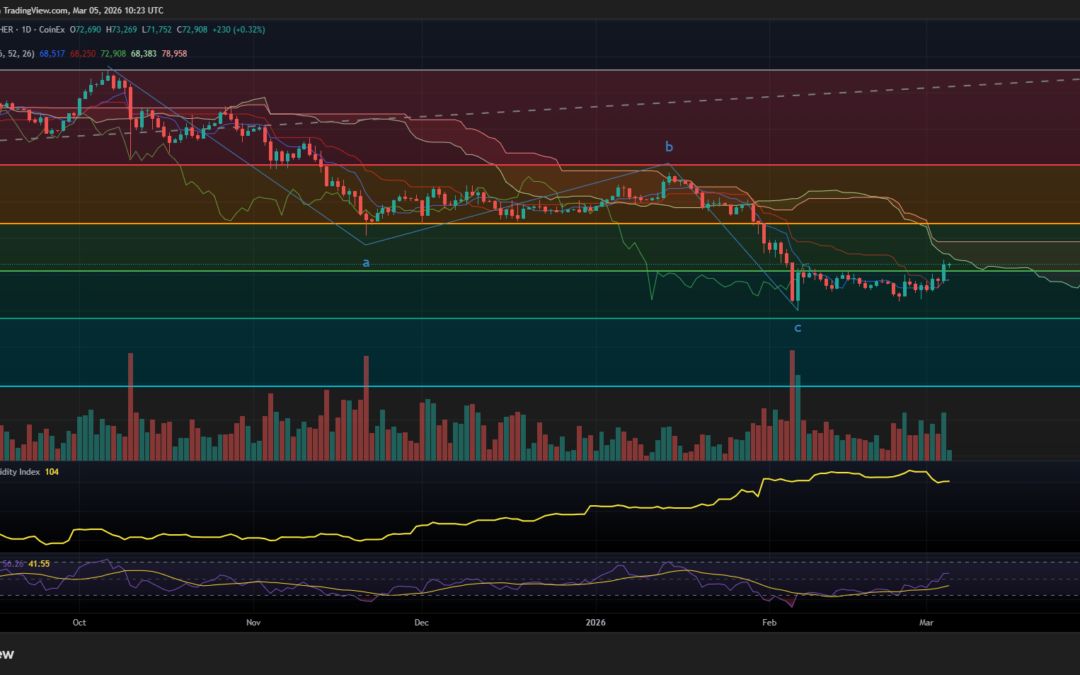
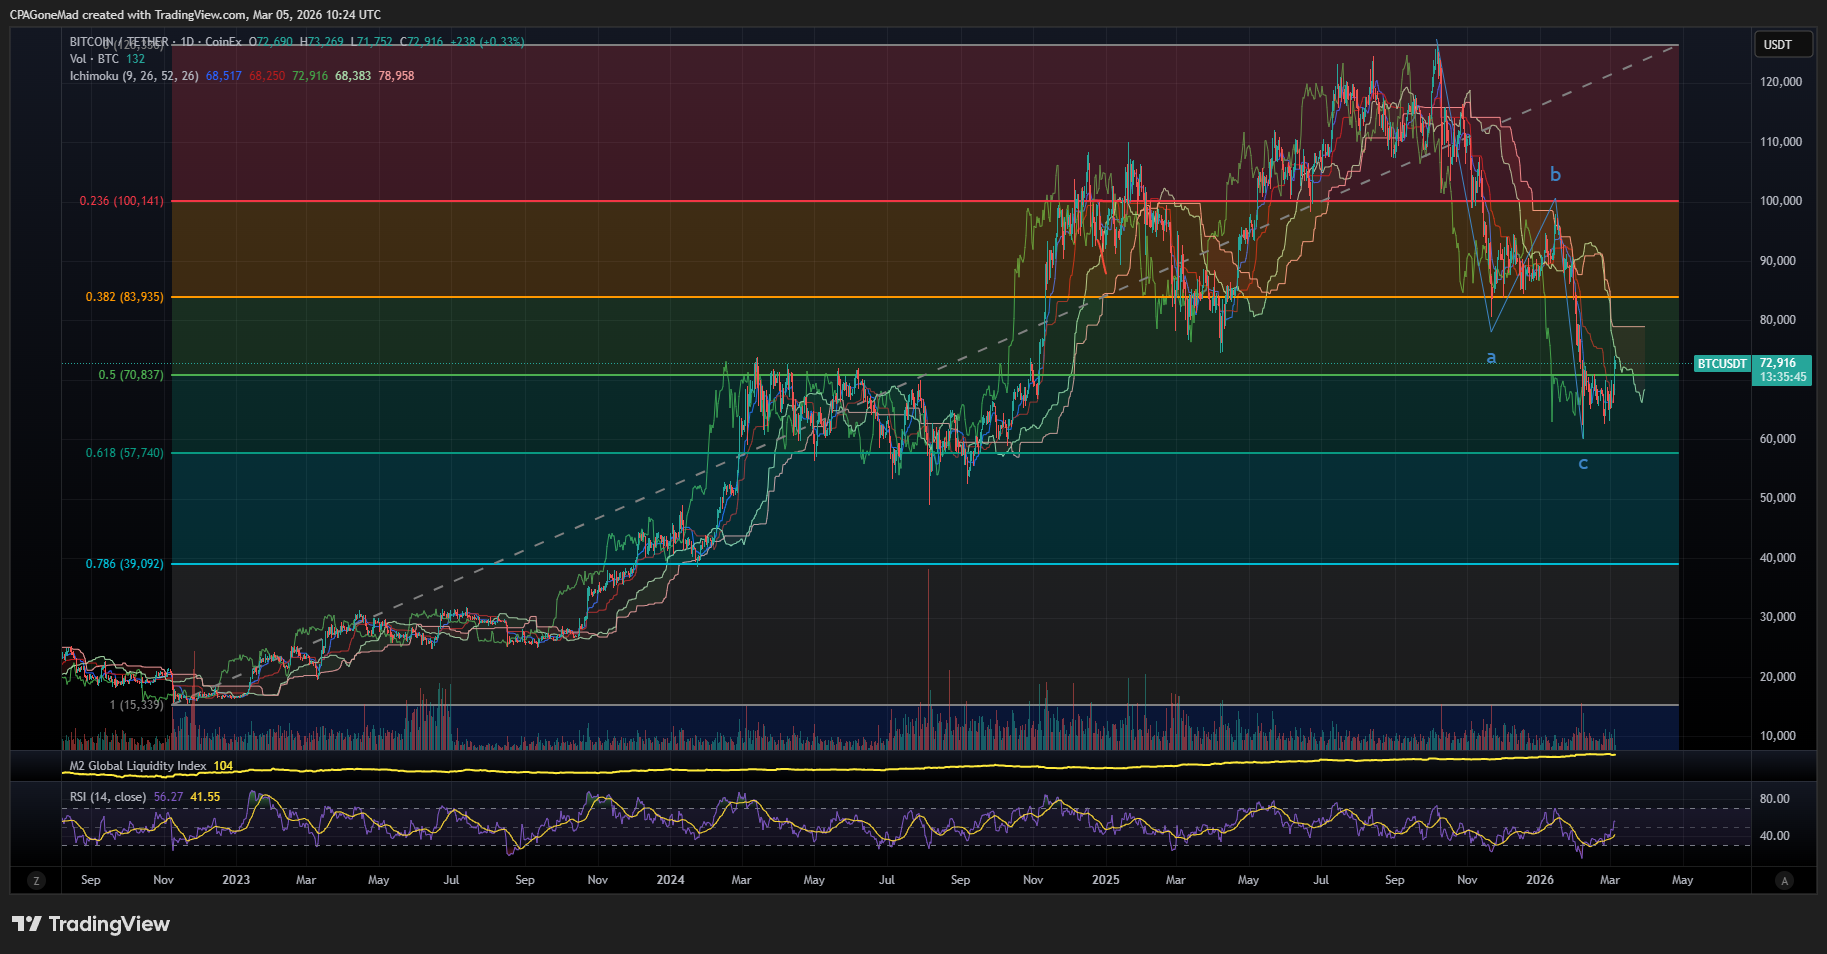
The daily chart with Ichimoku cloud overlay shows Bitcoin at $72,900, pressing into the cloud from below. The cloud runs from roughly $68,000 to $79,000. Entering the cloud from below is a transitional signal in Ichimoku analysis – you’re no longer in a confirmed downtrend, but you’re not in an uptrend either. You’re in no-man’s land. A breakout above the cloud top near $79,000 would be a major bullish confirmation. A rejection back below $68,000 would be bearish.
The M2 Global Liquidity Index is still at 104 and rising. This divergence between price and liquidity has been one of the strongest bull case arguments since February, and it’s still unresolved. Historically, when Bitcoin diverges from global liquidity, it resolves in the direction of liquidity. Which is up.
The daily RSI is at 41.55. That’s not oversold, but it’s far from overbought. There’s enormous room for RSI expansion on a rally. If wave 3 is launching, RSI should push toward 70-80 over the coming weeks.
On my 4-hour Gann chart zoomed out, the full cycle context from August 2024 through today shows price sitting at the intersection of multiple Gann arcs and diagonals. This is a classic Gann “price meets time” intersection where the geometric framework suggests a directional resolution is imminent. The Gann arcs that have defined this entire cycle – from the August 2024 lows through the October 2025 top – converge on the current time/price zone. That convergence should resolve in the next one to two weeks.
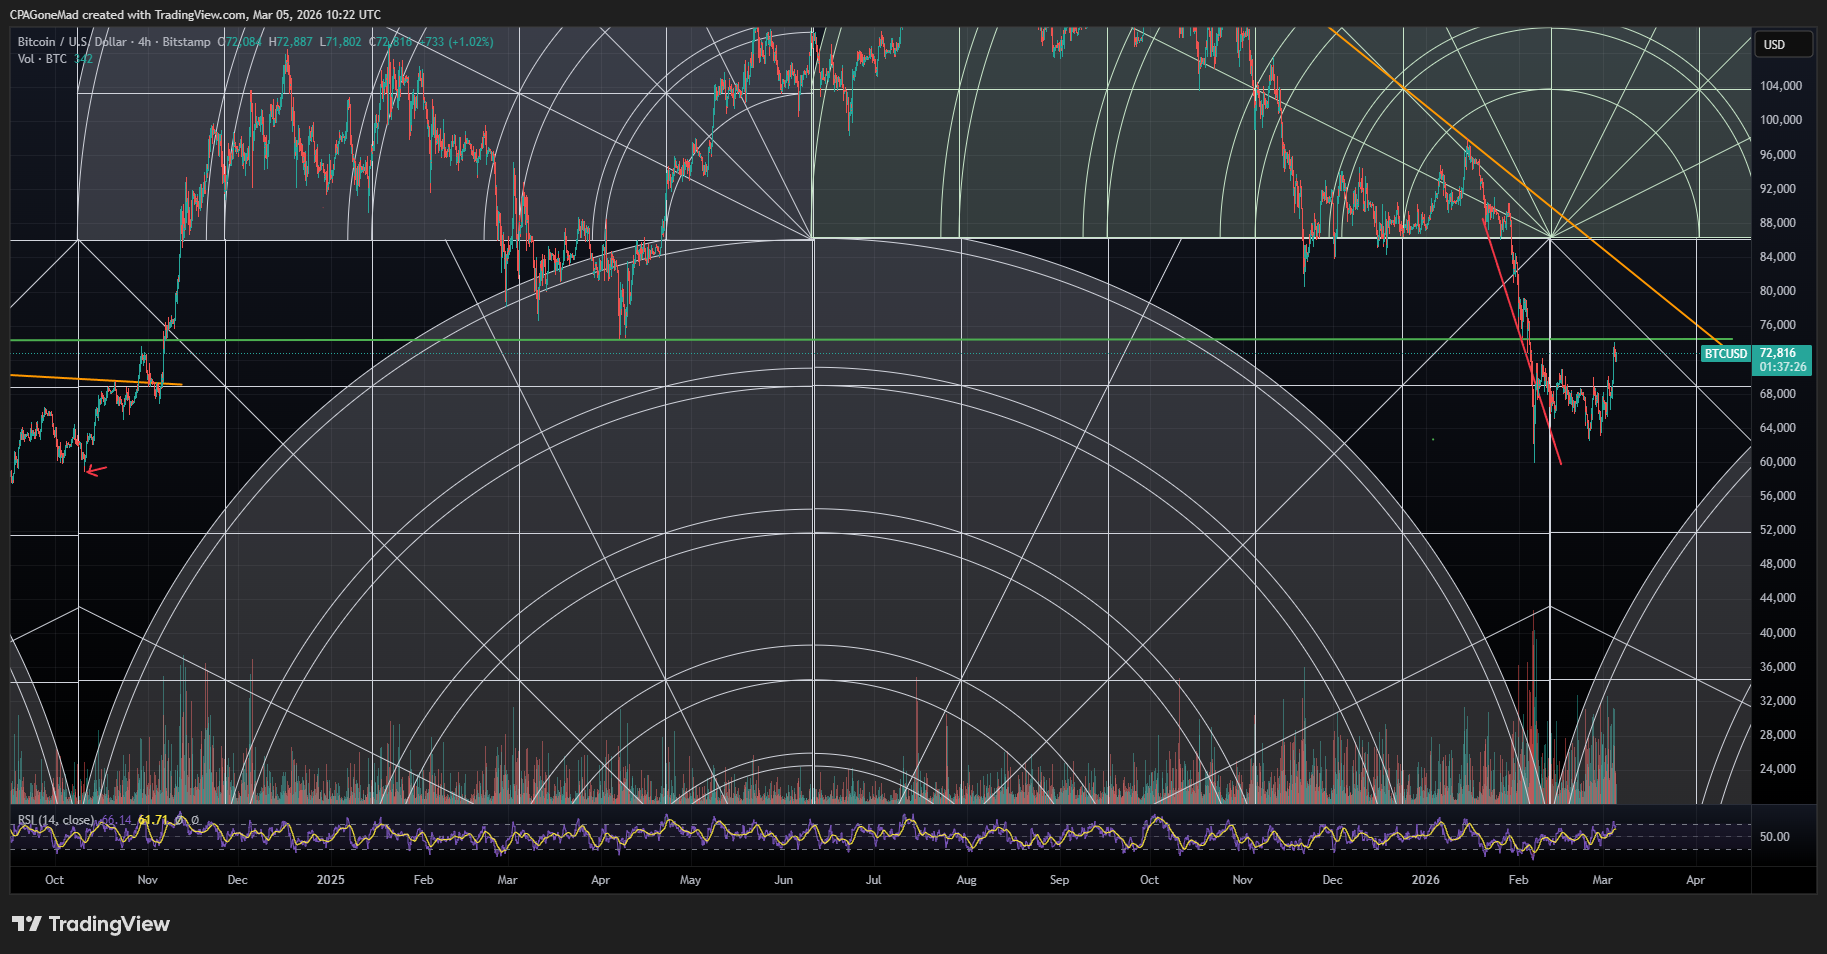
On the hourly wave count from the low, here’s my current labeling. From the larger wave 2 completion at $59,600, wave 1 of the larger wave 3 took price up to approximately $73,000. Then an A-B-C correction brought price back down to approximately $61,000 as wave 2 of the larger wave 3. From that wave 2 low, I’m tracking what could be the beginning of wave 3 of wave 3 – the sweet spot, the most powerful wave within the most powerful wave. Within that developing move, I can count a wave [1] up to about $70,000, then [2] down, and now a push back to $72,700 that’s approaching the wave 1 high.
This is the moment of truth on the wave count. The $73,000 level is the wave 1 high from the larger degree. In Elliott Wave theory, when wave 3 launches, it should break through the wave 1 high decisively – not stall, not chop around it, but blow through with expanding momentum. We’re at that test right now.
And the Fibonacci levels from the full cycle tell an important story. The February low at $59,600 bottomed right near the 0.618 retracement ($57,740) – the deepest level a normal wave 2 correction typically reaches. Price has now recovered back above the 0.500 retracement ($70,837). The next target on a breakout is the 0.382 at $83,935. That’s where wave [3] could be heading if the hourly count is right.
The Bear Case Is Weakening But Not Dead
I want to be fair to the other side. Because the bear case still exists, even if it’s getting harder to make.
The bearish alternative on the daily chart labels the entire bounce from $59,600 as a wave “b” in a larger a-b-c correction, with wave “c” still targeting $55,000-57,000 or lower. This count isn’t invalidated until price breaks above approximately $81,000. So from a pure Elliott Wave standpoint, the bears have room. And if you’re a bear, you’d point to the daily Ichimoku chart and note that price is still inside the cloud, not above it. Until it clears $79,000, the daily trend is officially neutral at best.
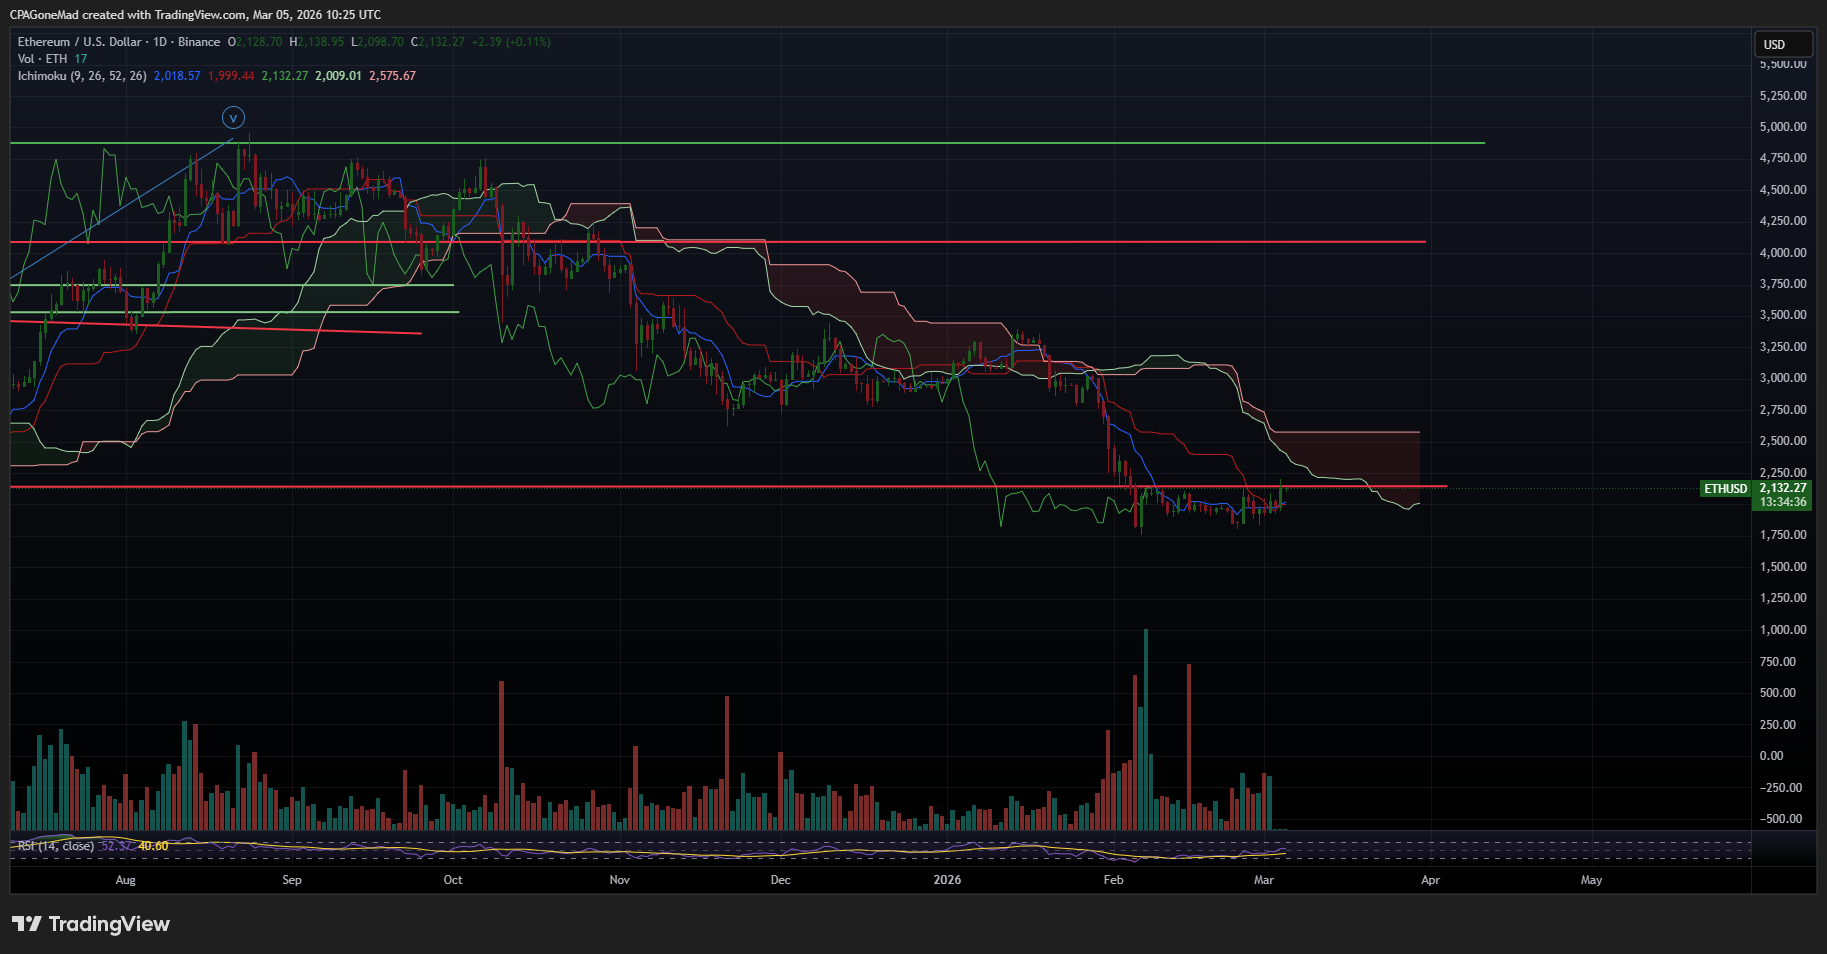
Ethereum is worth looking at separately because it tells a potentially concerning story. ETH at $2,132 is deeply below its Ichimoku cloud. The chart is ugly – there’s no other way to say it. A massive capitulation volume spike hit in early February, and while ETH has bounced, it’s doing so weakly compared to Bitcoin. If the broader crypto market were in a genuine new uptrend, you’d expect ETH to be participating. It’s not.
The bears would argue that Bitcoin is being propped up by institutional flows and ETF dynamics while the rest of the market screams “bear.” There’s something to that argument. Bitcoin dominance rising while altcoins languish is not typical of a healthy bull market. It can indicate a “flight to quality” within crypto – money flowing to the perceived safest asset as the broader market deteriorates.
But I’d counter with this: Bitcoin leading is exactly what you see at the START of a new impulse wave. Smart money concentrates in Bitcoin first. The alt rotation comes later, once Bitcoin’s trend is undeniable. If you waited for ETH to confirm before buying Bitcoin in October 2024, you missed the entire move from $49,000 to $125,000. Bitcoin leads. It’s always led. ETH weakness right now doesn’t invalidate the Bitcoin thesis – it might actually confirm it’s still early.
The ISM Manufacturing PMI came in this week still in expansion territory, though it printed lower than last month. A single month of deceleration while still above 50 is not a trend change. The ISM was at 52.6 last month. It’s still expanding. New orders were strong. But if the ISM rolls back below 50, that would be a material headwind for the bull thesis.
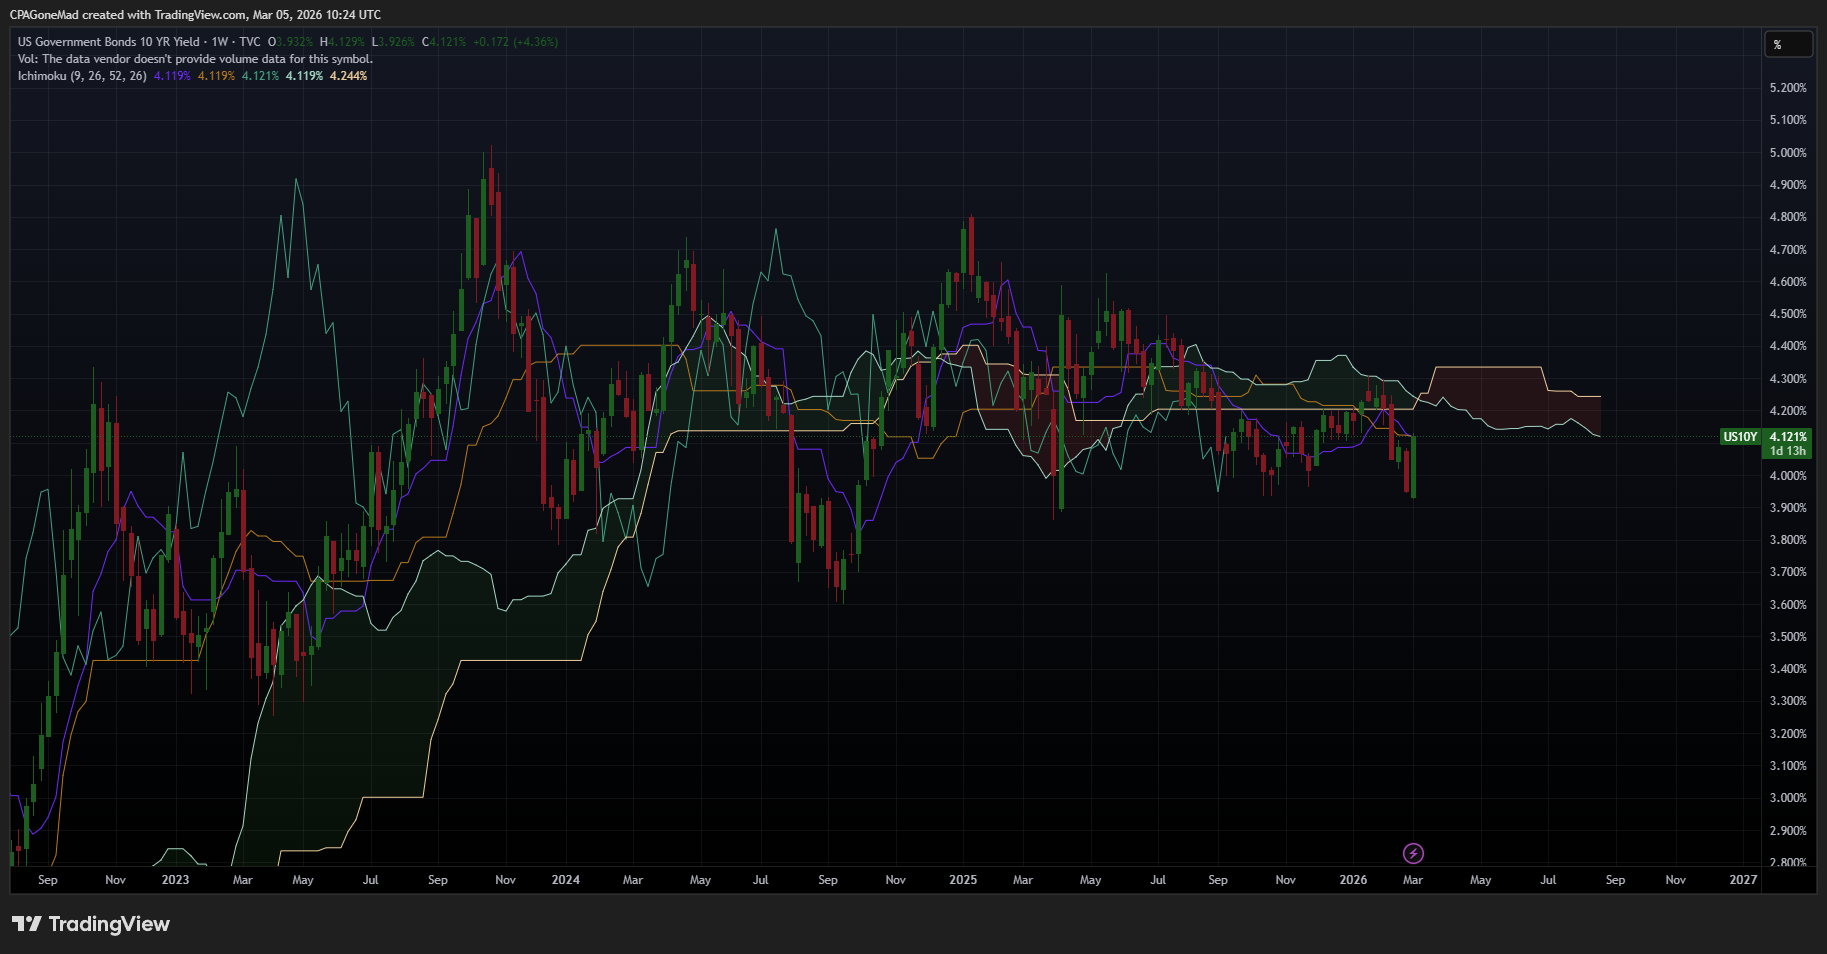
And the 10-year Treasury yield at 4.12% has actually moved higher this week, not lower – which tells you the bond market isn’t pricing this Iran conflict as a deflationary shock. It’s pricing it as inflationary. The weekly Ichimoku on yields shows extreme compression – all the lines converging around 4.10-4.25%. That compression will resolve, and the direction matters. If yields break higher on oil-driven inflation from the Iran conflict, that’s the scenario that could create a headwind for risk assets. But if the war ultimately forces the Fed to accommodate – more spending, more debt, more liquidity – then the short-term yield spike gives way to the longer-term debasement narrative. Wars are expensive. And expensive wars get paid for with printed money.
But here’s why the bear case is weakening despite all of this.
The Iran war was the bears’ best possible catalyst. A major military conflict involving the United States, oil price uncertainty, geopolitical chaos – this is exactly the kind of event that should trigger the next leg lower if the bearish count is correct. It didn’t. Price absorbed the shock, dipped modestly, and continued pressing higher. In Elliott Wave terms, when a correction refuses to extend on strongly bearish news, that’s one of the clearest signals that the selling pressure has been exhausted.
The New York Times published an opinion piece last week arguing that crypto is “basically useless.” The Financial Times published their “Bitcoin death knell” article on February 10. Two of the most prestigious news organizations on Earth, within weeks of each other, both declared Bitcoin dead. If you’ve studied market history at all, you know that this level of mainstream media consensus on the death of an asset class is a contrarian indicator of the highest order.
And the macro backdrop hasn’t changed. The Fed is still cutting. M2 is still rising. The dollar is still weak. The CLARITY Act is progressing. Goldman Sachs’ CEO admitted he owns Bitcoin. The structural tailwinds I outlined in February are all still blowing.
Why March 21 Is the Date That Matters
Here’s why I’m telling you to circle March 21 on your calendar.
Between now and then, we have a cluster of dates that converge across every framework I use.
March 10-12 is the standard Gann angle breakout window. In the October 2024 analog – the last time a major Gann date triggered a reversal – price broke the key Gann angle approximately 30 days after the date and then accelerated hard. February 10 plus 30 days is March 12. If the bull thesis is correct, price should be well above $76,000 and accelerating by this window.
March 17-18 is the FOMC meeting. With a war in Iran creating economic uncertainty and yields pushing higher on inflation concerns, the Fed is in a difficult spot. But with the administration needing economic strength heading into November midterms, the political pressure on the Fed leans accommodative. How the Fed threads that needle – acknowledging inflation risk while signaling continued support – will matter enormously for risk assets.
March 19-21 is the Vernal Equinox – one of Gann’s four major seasonal dates of the year. Gann believed that the equinoxes and solstices mark significant turning points in price and time. The Saturn-Neptune conjunction I discussed in my last post went exact on February 20. The effects of these conjunctions play out over months, not days, and the equinox window is the first major checkpoint where we can assess whether the structural shift is showing up in price.
So here’s my framework for resolution.
If by March 21 Bitcoin is above $80,000 with impulsive five-wave structure visible on the 4-hour chart, I will consider the bull thesis confirmed and begin writing about wave 3 targets. The basing process that’s frustrated everyone since February will have been exactly what it looked like in hindsight: the launchpad.
If by March 21 Bitcoin is still chopping between $67,000 and $76,000, the jury is still out. The basing is taking longer than expected but the bull thesis isn’t dead as long as $59,600 holds. I’d need to extend the timeline and look for catalysts into April and May.
If by March 21 Bitcoin is below $59,600, I was wrong. Full stop. The bearish count was correct. And I’ll own that publicly, just like I’ve owned every other time I’ve adjusted my view.
What I’m Actually Doing
I’m not changing my position. My Bitcoin allocation remains what it’s been. The thesis hasn’t been invalidated and the macro setup is still supportive. But I’m also not going to pretend I have certainty when I don’t.
What I AM doing is watching. Every day. Every candle. The character of the move from here is everything. If the nested 1-2’s on the hourly chart produce the wave 3 acceleration they’re setting up, the next few weeks could be the beginning of the most powerful move in Bitcoin’s history. If they don’t – if the 1-2’s were just me forcing a bullish count onto a bearish structure – then the pullback to $55,000 or lower is still on the table.
I don’t know which one it is yet. Neither do you. Neither does anyone.
But I know this: a war with Iran couldn’t break $59,600. The Financial Times and the New York Times declared it dead and it rallied to $73,000. The CEO of Goldman Sachs owns Bitcoin. The CLARITY Act is progressing. M2 is rising. The Fed is cutting. And the Gann geometry says the next two weeks are when price meets time.
Nothing is resolved. Everything is in play. But the evidence is building.
March 21 will tell us everything.
Stay patient. Stay honest. And keep watching.
For a deeper look at how I use Gann cycles, Elliott Wave analysis, and macro frameworks to navigate these markets, check out my first book Protect Your Money and Prosper and keep an eye out for my upcoming book Accelerate Your Money and Prosper – coming soon to coast2coastfinancial.com. And if you want these updates in real-time as this critical window plays out, make sure you’re signed up for the CPA Gone Mad newsletter. The next sixteen days could be the most important of this entire cycle.
Not financial advice, educational purposes only.