Three completely separate timing frameworks are pointing at Bitcoin right now. They don’t share methods. They don’t share assumptions.
One is based on a mathematical cycle system from 1909. Another watches planetary geometry. The third maps macro catalysts — ISM reports, Fed meetings, tax policy, fiscal stimulus — to specific calendar dates.
They’ve never agreed before.
They agree now. All three point to the same two-week window: late February through early March 2026. The cluster runs from February 20 through March 3.
If you’ve been following this analysis — from why the scoreboard is about to light up to what capitulation looks like — you’ve watched this case build since Bitcoin was above $100,000. The decline from $125,000 to $59,600 was expected. What stands out is how precisely the low arrived at the intersection of all three frameworks.
This doesn’t guarantee a rally. I’m going to lay out the bearish case too, because the same frameworks that predict a launch also define exactly what failure looks like. By March 3, you’ll know which side was right.
But here’s what’s impossible to ignore: three unrelated systems pointing to the same 14-day window. That’s not a prediction. That’s a convergence. And convergences deserve your full attention.
The Gann Framework
W.D. Gann was a trader in the early 1900s who believed markets move in predictable cycles based on time, price, and geometric angles. His methods are controversial. Some dismiss him as a mystic.
But his track record during the speculative booms and busts of the early twentieth century was documented. I’ve been applying his framework to Bitcoin since December 2023, and the results have been remarkably accurate.
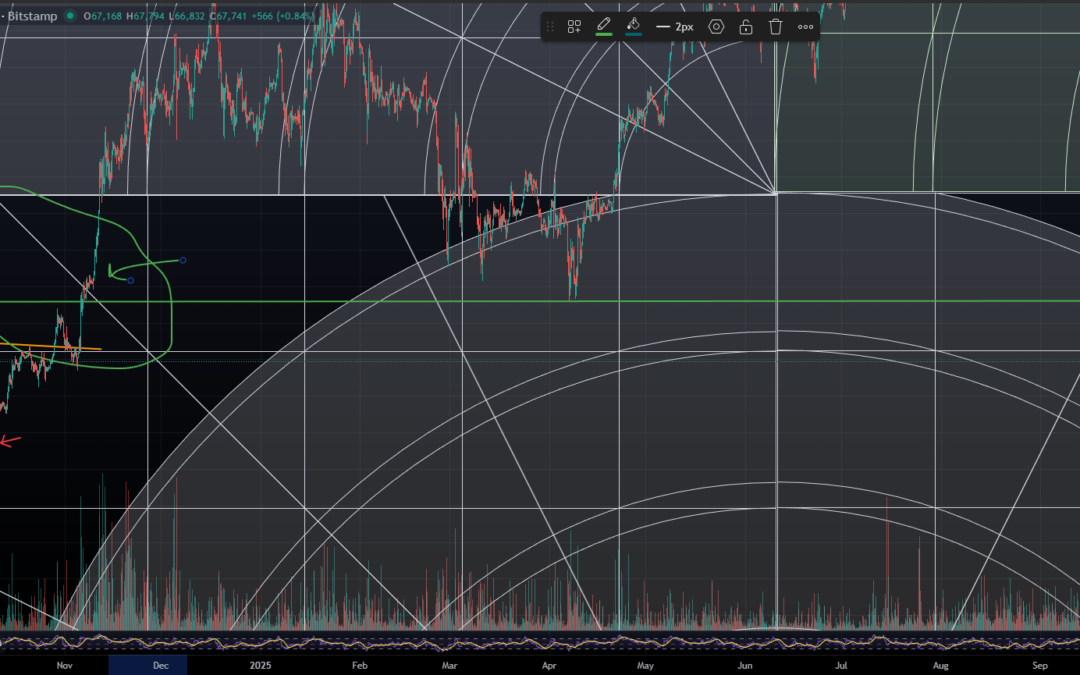
Here’s what the Gann calendar has called so far. February 6, 2024 marked a run to a high before correcting. October 8, 2024 launched the rally to $125,000. June 10, 2025 marked a low shortly before. October to December 2025 marked the cycle top.
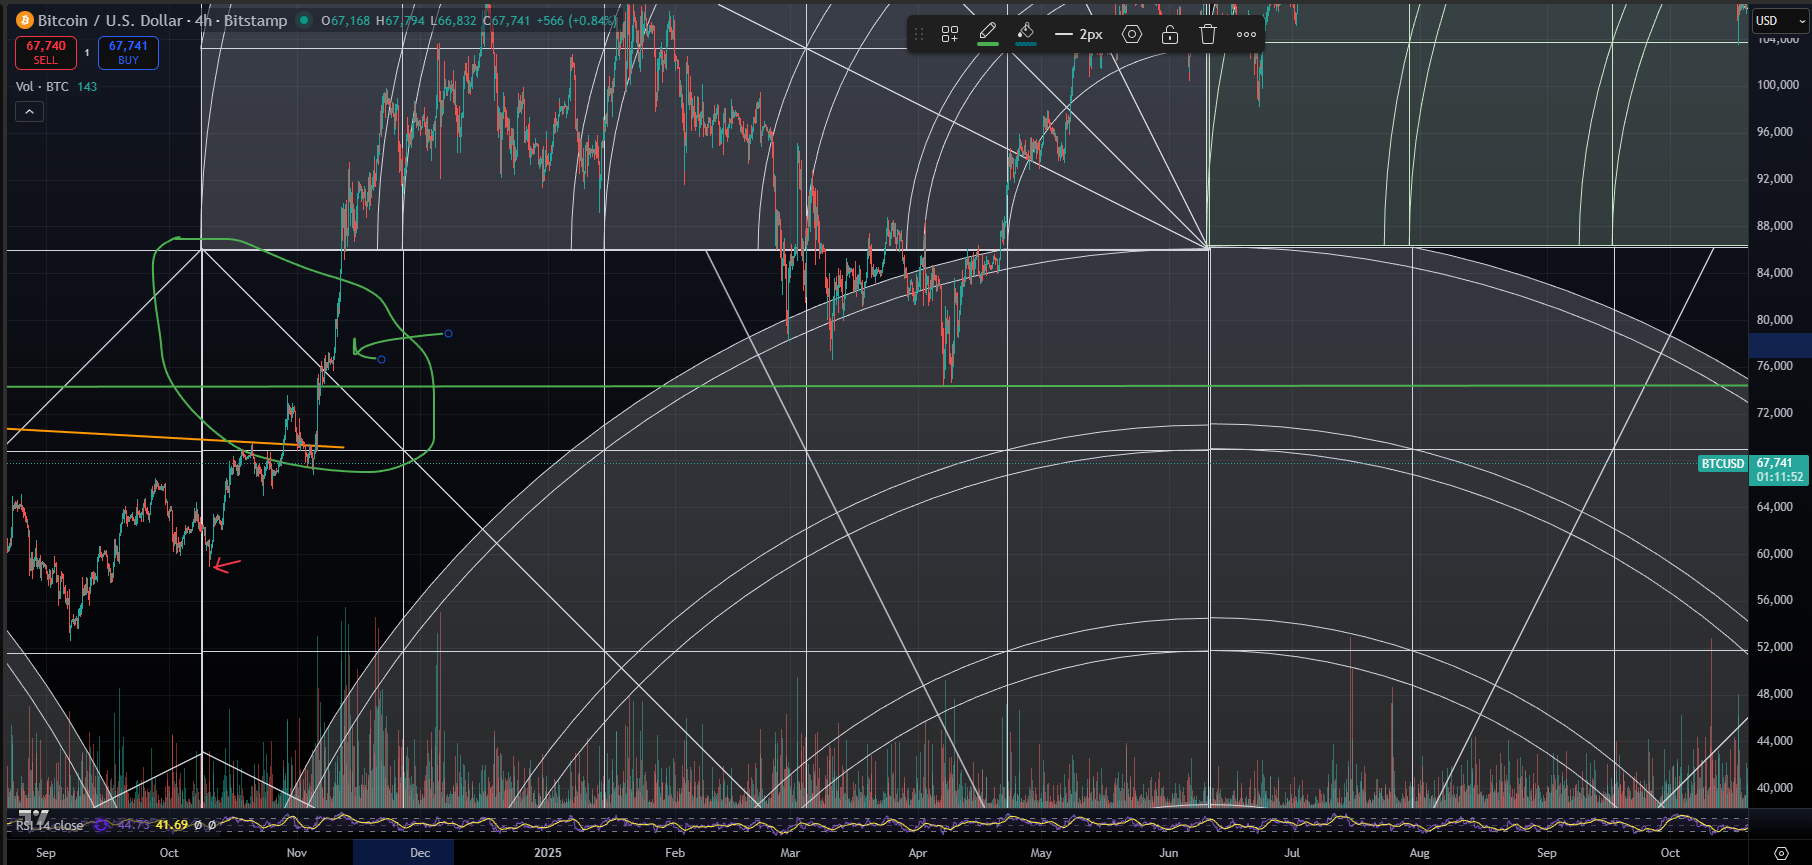
The current Gann date is February 10, 2026.
The October 2024 date is the analog that matters most right now. Price actually bottomed well before the Gann date — around August 5. Then it consolidated slowly into the October 8 window. It took roughly 30 days after the Gann date for price to break above the downward-sloping Gann angle and confirm the new uptrend.
That was wave 1 behavior. Slow. Grinding. Patient.
February 2026 looks different. Price didn’t wait for the date — it rushed to it. The decline from the January high was fast and violent.
Bitcoin hit $59,600 almost exactly on February 3 — one week before the February 10 Gann date. In Gann’s framework, this is called “squaring price and time.” The correction compressed itself to meet the time cycle.
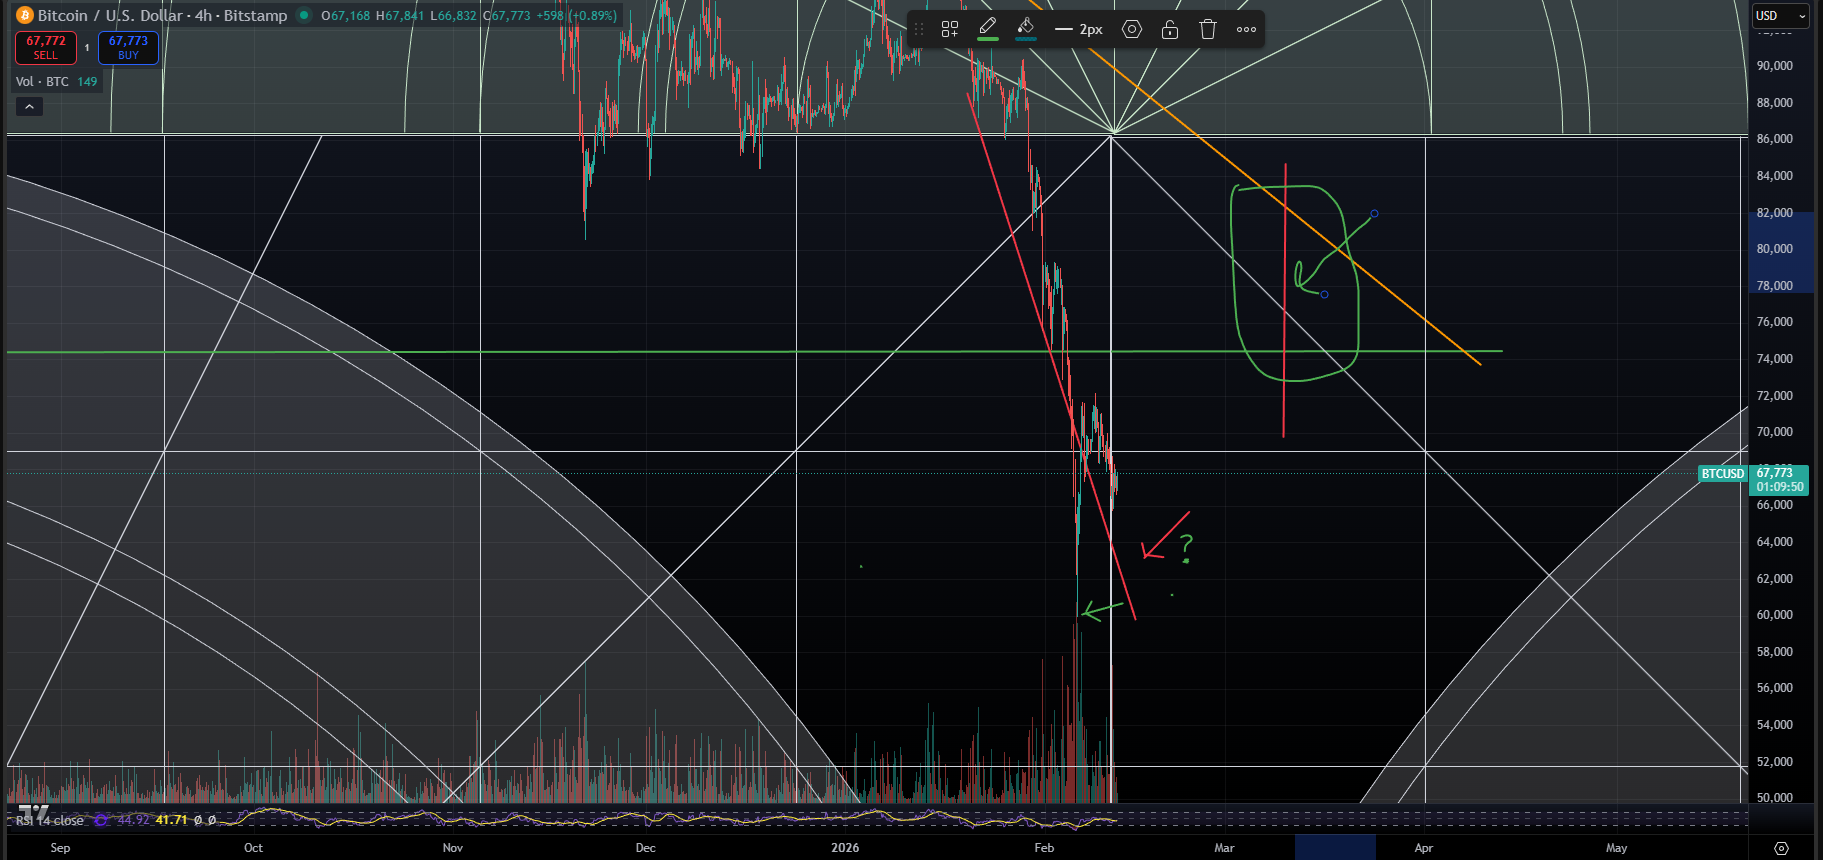
That compression tells you something about the energy building underneath this move. Wave 1 was slow. Bitcoin wave 3 should be fast.
Here’s the math. If the October 2024 analog holds exactly, the Gann angle breakout arrives around March 10-12 — roughly 30 days after February 10.
But wave 3s in Elliott Wave theory typically move 1.618 times faster than wave 1. That’s the golden ratio, and it shows up across markets with eerie consistency. Apply it: 30 days divided by 1.618 equals approximately 18-19 days. February 10 plus 18 days equals February 28.
A breakout confirmation by the end of February.
Then there’s March 19-21 — the Vernal Equinox. Gann considered this one of four “Major” seasonal dates where trend changes cluster. He wrote: “The year begins on March 21st, not January 1st.” If wave 3 is launching, you should see price decisively above resistance and accelerating by the equinox.
The Planetary Window
You’re probably thinking: astrology? For trading decisions?
Stay with this for a minute. You don’t need to believe planets cause market moves. You just need to notice that three independent frameworks — one mathematical, one astronomical, one fundamental — converge on the same dates. When that happens, it’s worth investigating, regardless of how you feel about any individual method.
Financial astrologers have been watching a major alignment approaching on February 20: the Saturn-Neptune conjunction at 0 degrees Aries. This happens roughly every 36 years. The last one was 1989 — when the Berlin Wall fell and the Japanese asset bubble popped.
Practitioners call it a “great reset” signature. They associate it with dissolution of institutions, financial instability, debt crises, and the collapse of old narratives.
Some analysts note this conjunction hits the exact Midheaven angle of the Federal Reserve’s natal chart, using the Fed’s founding date of December 23, 1913. The symbolism isn’t subtle. A “reset” of central banking arriving exactly when Kevin Warsh is awaiting confirmation as the next Fed Chair and the Fed’s independence faces historic political pressure.
Then there’s the eclipse window. A solar eclipse lands on February 17 in Aquarius — the sign associated with technology, innovation, and cryptocurrency. A total lunar eclipse follows on March 2-3. Eclipses have historically correlated with sudden shifts in risk appetite, policy announcements, and information surfacing that was previously hidden.
That creates a concentrated volatility window from roughly February 14 through March 3.
The bullish interpretation: the February 17-20 cluster — eclipse plus conjunction — produces the volatility spike, potentially a final flush of weak hands. Then February 22 brings a Venus-Jupiter alignment, which practitioners call the first “all clear” signal.
March 2-3 marks Venus entering its strongest annual position — “the day to watch most closely,” according to the financial astrologers tracking this alignment.
The pattern: concentrated pain from February 17 through 20, followed by reversal confirmation from February 22 through March 2.
Sound familiar? That’s almost exactly what the Gann framework predicts. A breakout by February 28, with confirmation by early March.
Two completely separate systems. Same window.
The Macro Catalyst Calendar
Here’s where the fundamental calendar stacks up. Take every major scheduled event between now and the end of March, and map them against the Gann and planetary windows.
| Date | Catalyst | Why It Matters |
|---|---|---|
| Feb 17 | Solar Eclipse (Aquarius) | Volatility catalyst for technology and crypto |
| Feb 20 | Saturn-Neptune Conjunction | “Great reset” alignment — first in 36 years |
| Feb 22 | Venus-Jupiter Alignment | “All clear” signal per planetary framework |
| Late Feb | Tax Refund Peak | $91B extra stimulus from OBBBA hitting economy |
| Mar 2 | ISM Manufacturing PMI | February data — tracking ISM trajectory toward 60 |
| Mar 2-3 | Total Lunar Eclipse | Trend confirmation window |
| Mar 11 | February CPI Release | Next inflation read |
| Mar 17-18 | FOMC Meeting | Rate decision under Powell |
| Mar 19-21 | Vernal Equinox | Gann Major Date — seasonal trend change |
| Q1 2026 | eSLR Relief Takes Effect | Banks freed to buy Treasuries — liquidity injection |
| May 15 | Powell’s Term Ends | Warsh takes over — expected dovish pivot |
Look at the cluster from February 17 through March 3. You’ve got a solar eclipse, the biggest planetary alignment in 36 years, tax refunds hitting bank accounts, an ISM reading, and a lunar eclipse — all inside 14 days.
Political survival may be the most bullish signal of all heading into November 2026 midterms. This calendar shows you why. Every political incentive points toward more liquidity, not less.
The Tax Refund Nobody’s Watching
This catalyst deserves its own section because almost nobody is pricing it in.
The One Big Beautiful Bill Act passed in July 2025. Among other provisions, it reduced individual income taxes for 2025 by an estimated $129 billion. Good news for your tax bill.
Here’s the catch. The IRS never adjusted its withholding tables after the law passed. Your employer kept taking out the old, higher amounts from every paycheck through the second half of 2025. You effectively lent the government your money at zero interest for six to twelve months.
Now that money comes back. All at once.
Filing season opened January 26, 2026. Americans are about to receive approximately $91 billion more in refunds than a typical year, according to the Tax Foundation and the Joint Committee on Taxation. Your refund could include an extra $300 to $1,000 you weren’t expecting.
Private sector analysis suggests this could boost annualized real GDP growth by over half a percentage point in Q1 2026. Peak refund season runs from February through early April — landing right in the middle of the convergence window.
Think about what that means. Ninety-one billion dollars of unexpected money arriving in consumer bank accounts during the exact two-week window when three timing frameworks converge. Some goes to bills. Some goes to savings.
And some — especially among younger demographics who already hold crypto — flows directly into risk assets.
You won’t see this variable in most market analysis. Tax refund flows don’t appear in M2 data or Fed balance sheet reports. They’re a direct injection into your spending and investment accounts. And they’re hitting right now.
The Mirror Image of February 2022
Four years ago, Bitcoin topped at $69,000 in November 2021 and spent February 2022 confirming the start of its bear market. Look at what the macro backdrop showed then — and compare it to what you’re seeing today.
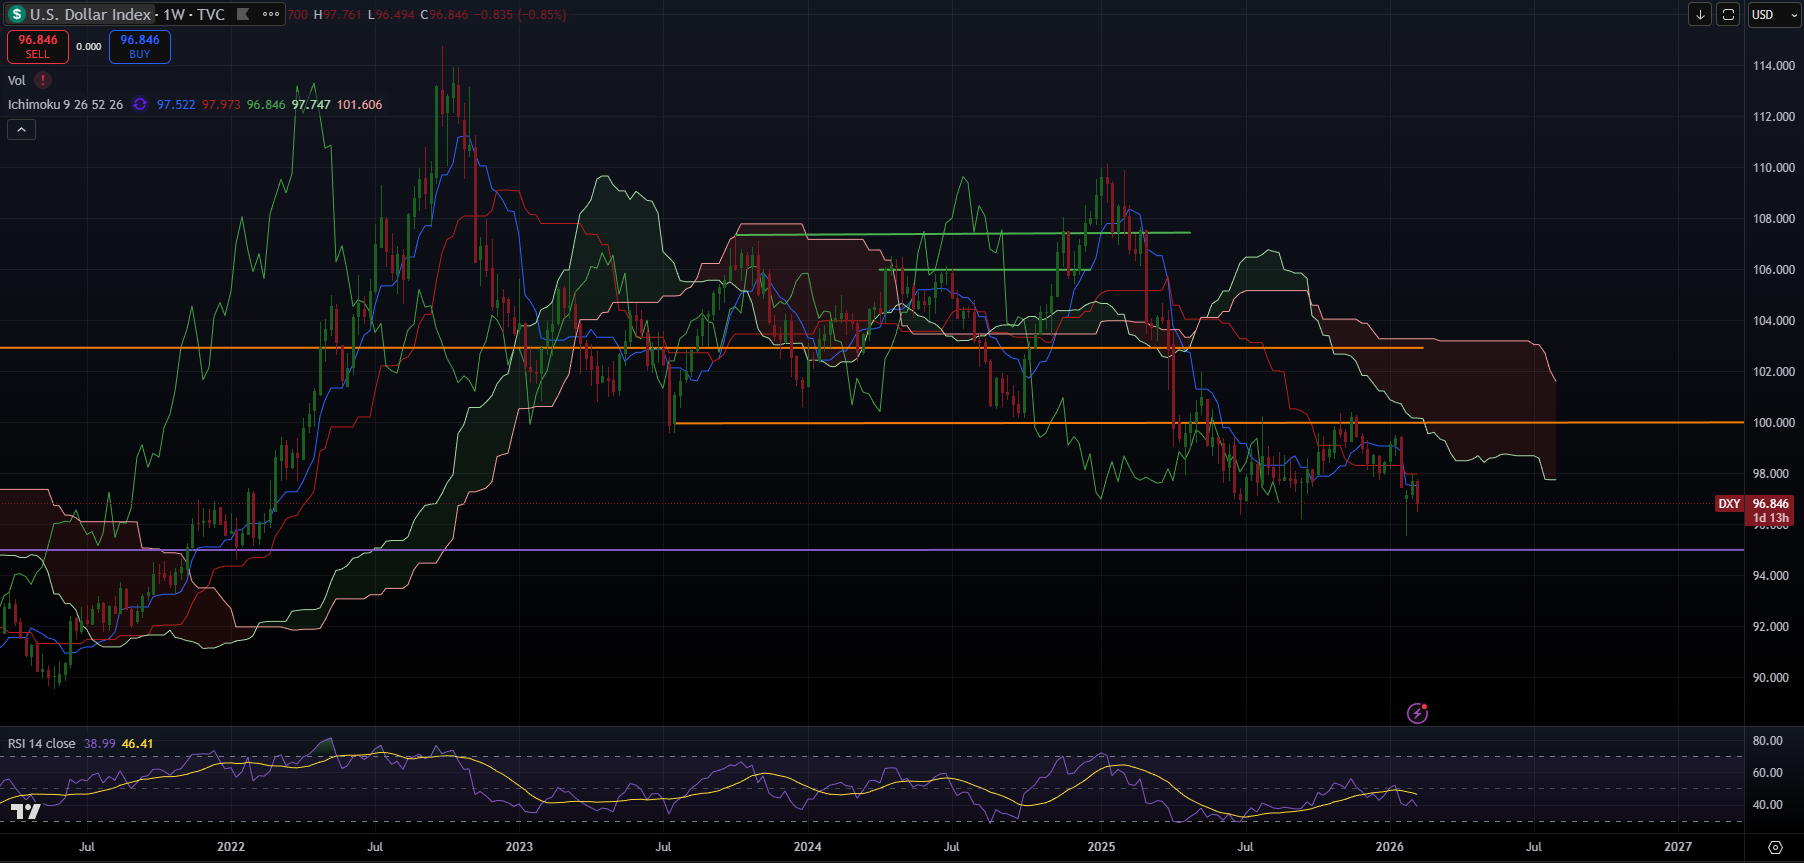
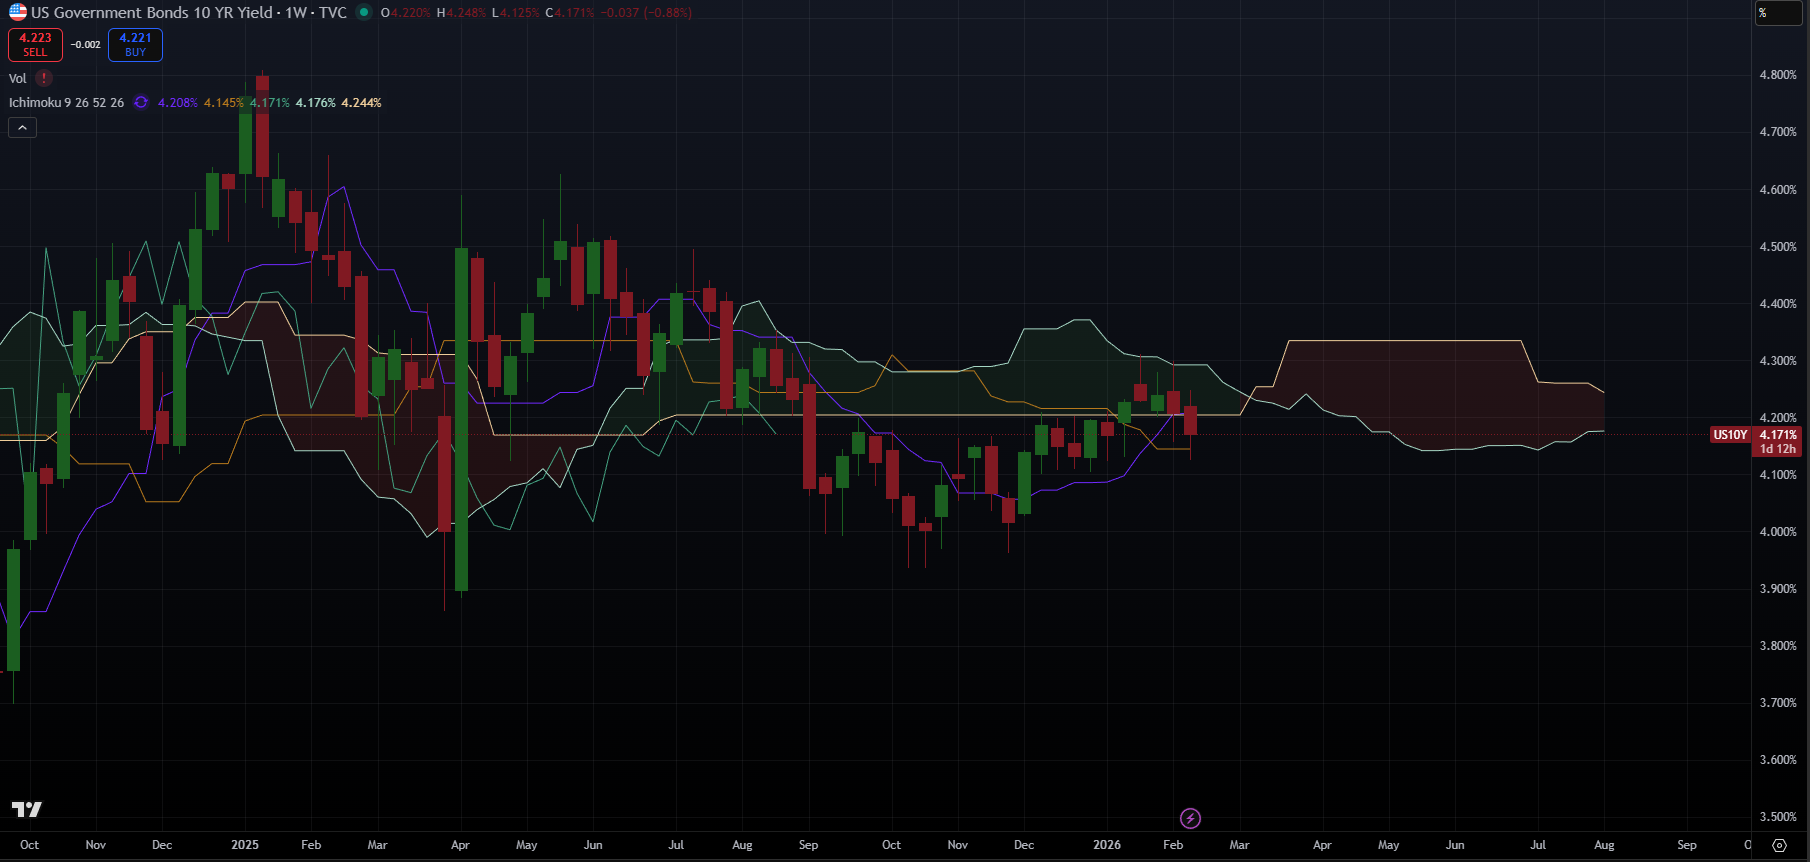
In February 2022, the dollar was breaking up through 96 on its way to 114. Today, the dollar is breaking down through 100, sitting at 96.85. You can read about the dollar breakdown here.
In February 2022, the 10-year Treasury yield was spiking higher, heading from 1.8% toward 4.3%. Today, the 10-year sits at 4.17% and is trending lower.
In February 2022, M2 liquidity was contracting as the Fed began its most aggressive tightening cycle in decades. Today, M2 Global Liquidity is at 104 and rising. The Fed ended quantitative tightening on December 1, 2025 and started Reserve Management Purchases on December 12.
In February 2022, gold was flat to declining. Today, gold is parabolic. GLD went from $300 in June 2025 to $510 at its recent peak — a 70% move in eight months.
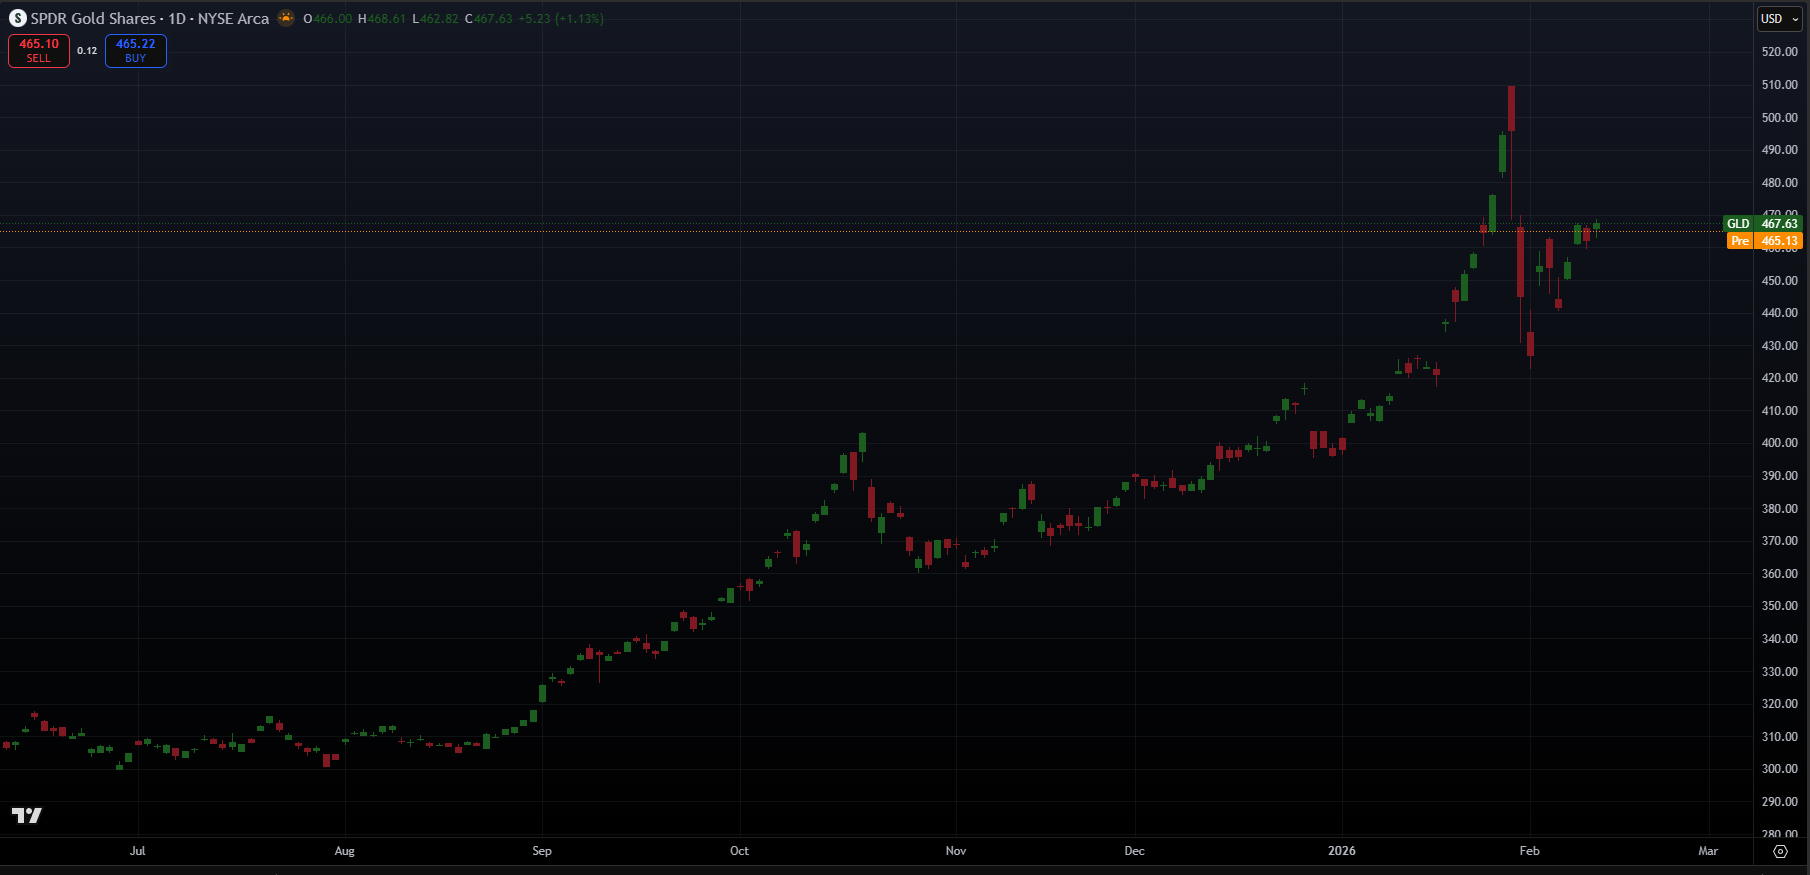
That’s what Raoul Pal calls the “debasement bid.” When gold leads at major turns, institutional safe-haven money moves first. Bitcoin — the higher-beta, retail-accessible version of the same trade — follows.
I wrote about why this is not 2022. The mirror image couldn’t be more exact. Every headwind that confirmed the 2022 top is now a tailwind potentially confirming the 2026 bottom.
Dollar falling instead of rising. Yields declining instead of spiking. Liquidity expanding instead of contracting. And gold and Bitcoin working as teammates — sending you the same signal at every major turn.
The RSI and M2 Divergence
Here’s a number that should get your attention. Bitcoin’s daily RSI sits at 28.59. That’s deep capitulation territory — matching the oversold readings at the August 2024 bottom and other major cycle lows.
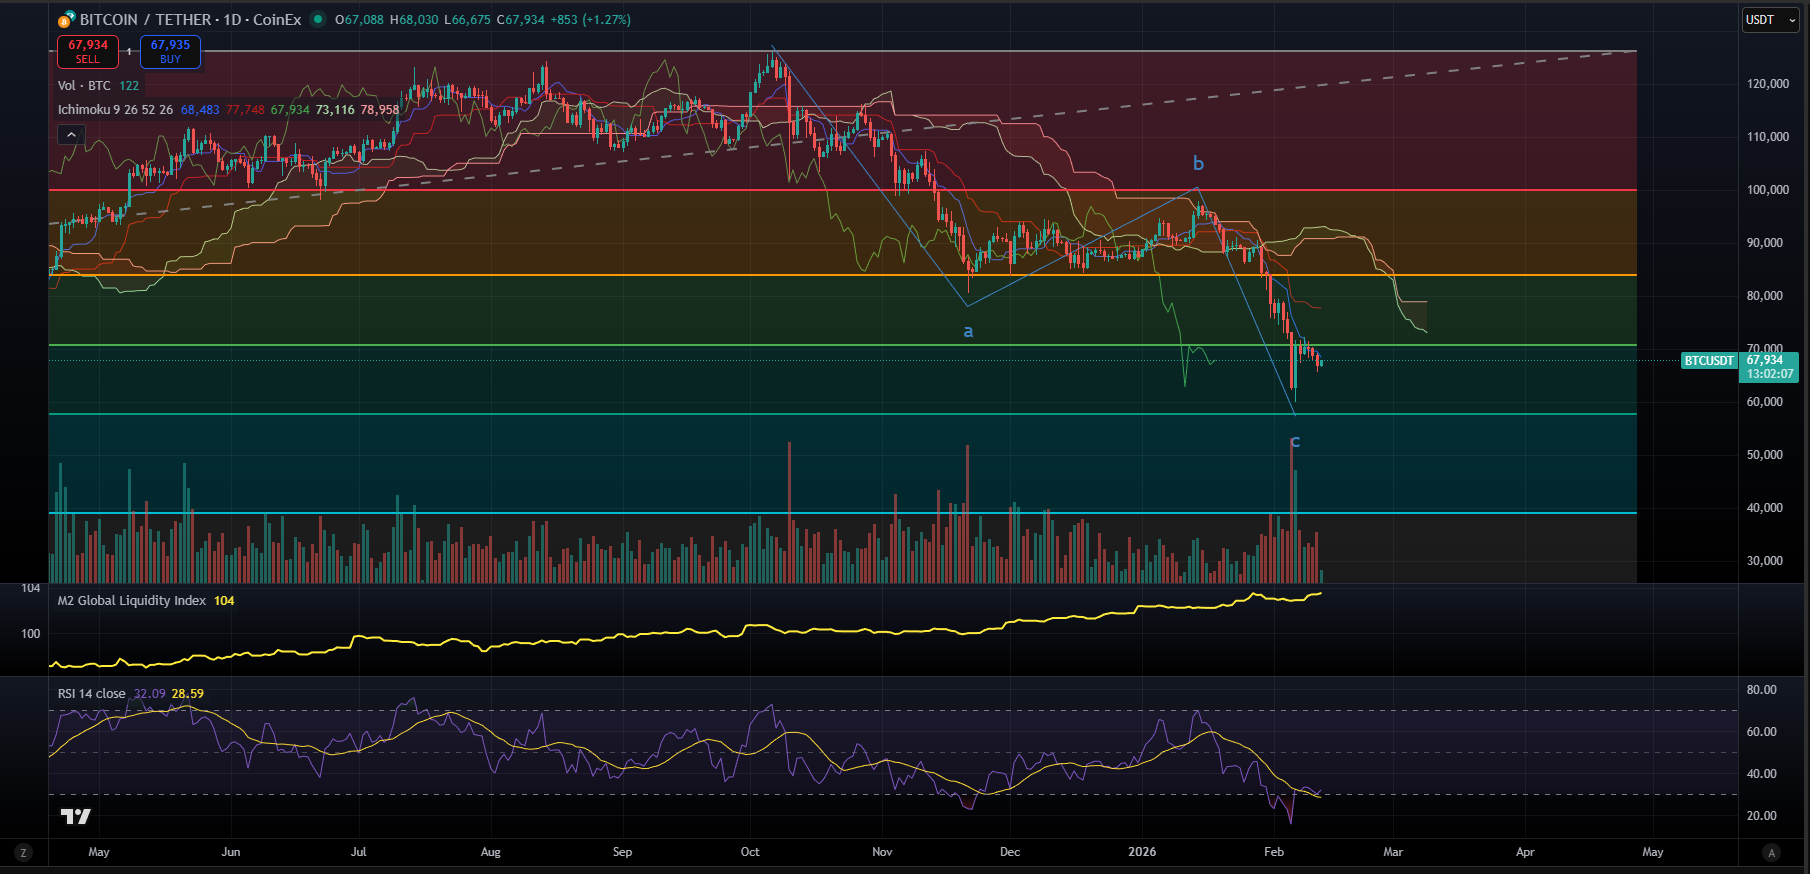
Meanwhile, the M2 Global Liquidity Index sits at 104 and keeps rising. Price is falling while liquidity is expanding. That’s a divergence, and divergences always resolve.
They resolve one of two ways. Either liquidity reverses lower — meaning macro tightening resumes — or price catches up to liquidity, and a rally begins.
The Fed ended QT on December 1. Started buying again on December 12. Actively cutting rates. Facing intense political pressure ahead of November 2026 midterms.
Option one — sudden tightening — seems unlikely.
That leaves option two. Price catches up to liquidity. The RSI snaps from 28 back toward 50 or higher. That’s the wave 3 thesis in a single chart.
Volume at the Low
Gann taught a simple volume rule: “Volume increases on rallies and decreases on reactions in bull markets. Volume increases on reactions and decreases on rallies in bear markets.”
On February 3, as Bitcoin hit $59,600, volume spiked significantly on the 4-hour chart. Capitulation selling met by accumulation buying. High volume at the low represents a transfer from weak hands to strong hands.
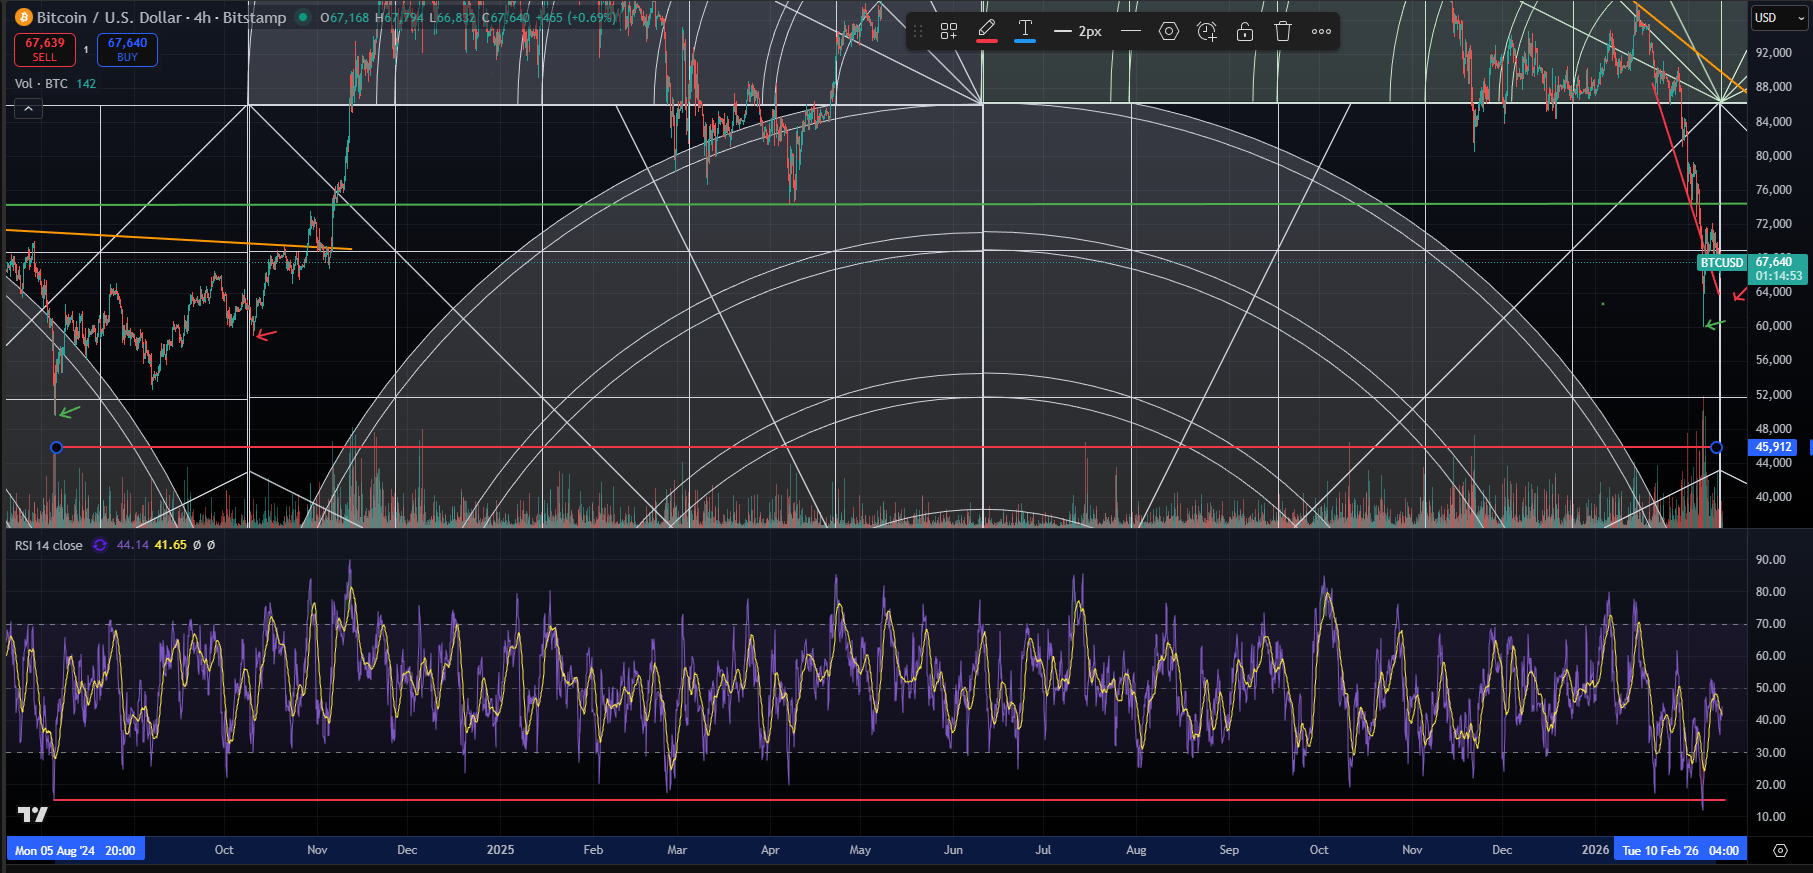
But one spike isn’t proof. Here’s what confirms it.
You need to see the next decline happen on lower volume than the February 3 low. And the next rally on higher volume than the bounce from February 3. If price makes a higher low on declining volume, followed by a rally on expanding volume, that’s the accumulation pattern Gann described.
If instead price breaks to new lows on high volume, the bear case takes over. Volume doesn’t lie. Watch it closer than price over the next two weeks.
The Bearish Case
I’ve given you seven sections of bull case. Now here’s what could go wrong.
The hourly wave count from the January high looks ambiguous. What appears to be wave C completing could instead be wave 3 of a larger impulse down. If the decline from $125,000 is impulsive — five waves rather than three — targets of $50,000-$55,000 or even $28,000-$30,000 come into play.
You can read about what that risk looks like when the data gets scary. The honest answer is the wave structure hasn’t fully resolved yet.
The planetary framework cuts both ways. The same astrologers watching the February 17-20 window see it as specifically bearish for crypto. One forecast projects Bitcoin “vulnerable to declines toward $70,000.” Since you’re already below that level, that’s not reassuring. Another projects sub-$50,000 by October 2026 based on Bitcoin’s 1064/364 day cycle pattern.
Then there’s the “great reset” risk. If the Saturn-Neptune conjunction truly represents dissolution of institutions and financial instability, the initial move could be down, not up. A banking crisis, credit event, or sudden market shock during this window would invalidate the bullish thesis entirely.
Finally, even if the bottom is in, the market may need more time. The October 2024 analog took 30 full days to break the Gann angle. February 2026 could need similar patience. A wave 2 correction after the initial rally could pull price back toward $60,000-$63,000 before wave 3 truly launches.
That’s not bearish. But it’s not the V-bottom rocket ship either. This section exists because analysis that doesn’t acknowledge what could go wrong isn’t analysis — it’s salesmanship.
Why I Lean Toward Bitcoin Wave 3
With the bearish case on the table, here’s why my bias remains bullish.
Three independent frameworks pointing to the same window is unusual. It’s not impossible for all three to be wrong simultaneously. But synchronized failure across unrelated systems is statistically uncommon.
The macro backdrop provides the strongest argument. Dollar declining. Yields falling. M2 expanding. The Fed actively easing.
Political incentives overwhelmingly favor liquidity ahead of November midterms.
Then there’s the ISM. Manufacturing just posted its biggest jump since the post-COVID recovery, surging to 52.6 when 48.5 was expected. Historically, when ISM crosses above 52.6, Bitcoin returns over the following 12-18 months have ranged from 7x to 55x. Your portfolio deserves to know that number.
The RSI at 28.59 while M2 climbs to 104 creates a divergence that must resolve. Given the policy direction, price catching up to liquidity is far more probable than liquidity suddenly reversing lower.
The gold signal adds another layer. Gold leading Bitcoin at major turns is a consistent pattern across cycles. GLD’s 70% move from June to its January peak tells you debasement capital is mobilizing. That capital has historically rotated into Bitcoin as the cycle matures.
I called wave 3 when conviction was easier. My conviction is stronger now that the data has deepened.
And $91 billion in unexpected tax refunds arriving during the exact convergence window? That’s the kind of variable most models miss entirely.
I could be wrong. That’s why the next section gives you specific targets — and the one after that tells you exactly what proves me wrong.
Price Prediction Timeline
Here’s what the convergence suggests if the V-bottom thesis plays out.
| Window | Target Range | Basis |
|---|---|---|
| Now – Feb 17 | $64,000-$68,000 | Choppy consolidation, possible support retest |
| Feb 17-20 | $62,000-$66,000 | Eclipse and conjunction volatility — potential final flush |
| Feb 22-28 | $70,000-$73,000 | “All clear” signal, impulsive rally begins |
| Mar 2-3 | $73,000-$78,000 | Lunar eclipse confirmation, Gann angle break |
| Mar 10-12 | $78,000-$85,000 | Full Gann breakout (accelerated timeline) |
| Mar 19-21 | $85,000-$92,000 | Vernal Equinox — wave 3 acceleration |
| End of Q1 | $90,000-$100,000 | Reclaim October 2025 range |
| June 2026 | $120,000-$150,000 | Wave 3 intermediate target (ISM approaching 60) |
| Oct-Nov 2026 | $175,000-$200,000 | Wave 3 completion zone, pre-midterm liquidity peak |
Key confirmation levels to watch. $70,000 is your first signal — reclaiming the round number. $76,000 takes back the 0.382 Fibonacci retracement of the entire decline.
$81,000 breaks above the November wave A low. And $100,000 means the new uptrend is established beyond reasonable doubt.
What Proves Me Wrong
Every thesis needs a kill switch. Here they are.
The primary invalidation is $59,600. A daily close below the February 3 low on expanding volume confirms the decline is impulsive, not corrective. If that breaks, your next targets are $55,000, then $50,000, then $44,000-$48,000.
No ambiguity. No re-interpretation.
The secondary invalidation is the character of the bounce. If the rally unfolds as a choppy three-wave structure — an A-B-C correction rather than a clean five-wave impulse — and fails at $70,000-$73,000 resistance, the bear case takes over. Wave 3 moves don’t chop. They drive.
The third invalidation is macro. If the dollar spikes back above 100, the 10-year yield surges above 4.5%, or M2 contracts, the liquidity thesis fails. No amount of Gann angles or planetary alignments will overcome a genuine tightening of financial conditions.
Finally, March 2-3. If price is still below $70,000 at the lunar eclipse window — struggling and looking corrective — then the consolidation or bearish scenarios become your higher-probability outcomes.
By March 3, one of three things will be true. Price above $73,000 and accelerating — bullish thesis confirmed. Price chopping between $65,000 and $72,000 — consolidation, patience required. Price below $60,000 — bearish thesis confirmed, deeper targets in play.
No hedging. No goalpost-moving. Those are your benchmarks.
What to Watch
Three frameworks. One window. February 20 through March 3.
Gann’s cycle mathematics point to a breakout by February 28. Planetary geometry concentrates volatility between February 17-20, with a reversal window from February 22 through March 2. And the macro calendar stacks eclipses, ISM data, tax refunds, and policy catalysts into the same 14 days.
Each framework alone would be interesting. Together, they form a convergence I haven’t seen in my years of tracking these systems.
I’ve laid out the thesis. I’ve defined the kill switches. The answer is coming fast — you’ll know within three weeks whether the convergence delivered or collapsed.
Watch the character of the move, not just the price. If the rally from this zone is impulsive — sharp, strong, relentless, on rising volume — that’s bitcoin wave 3 announcing itself. If the move is sloppy, corrective, and dying at resistance, something else is happening.
I’ll be sharing updates as each date arrives. Whether I’m right or wrong, you’ll hear about it here. That’s the deal — honesty about the calls, not just the wins.
This is analysis and education — not personalized guidance. It’s my attempt to make sense of a market that rewards your preparation and punishes your certainty.
For updates on this analysis as each date arrives, subscribe to the CPA Gone Mad newsletter — it’s free.
Disclaimer: Not financial advice, educational purposes only. The views expressed in this article are my personal opinions based on my own research and analysis. I am not a registered financial advisor. Nothing in this article should be construed as a recommendation to buy, sell, or hold any asset. Do your own research and consult with a qualified financial professional before making any investment decisions.