
Every audit has a date on the engagement letter. The work gets done, the file gets closed, and the opinion gets signed — on that date, not when the numbers look better.
Chapter 7 of Accelerate Your Money and Prosper put a date on my engagement letter: October 13, 2026. The scorecard post I published in September repeated it in public, before the window opened, with the promise that it would be graded in a follow-up — never by editing the original.
This is the follow-up. The date arrived this week. Here is the grade.
What was on the record before the window opened
I want you to see the exact words, because the grade only means something against the exact words.
From the front of the book: “The next date on my calendar is October 2026. Bitcoin may trade lower into it. But with the macro tailwinds above at its back… the date opens the window for the next cycle to begin.”
From Chapter 7: “October 13, 2026 is the next important date. Will Bitcoin trade lower into this date? It may. Or this could signal the date Bitcoin finally crosses back above its 200 day moving average. I don’t know what price will do into this date but this date signals the opportunity for Bitcoin’s next bull run to begin.”
From the scorecard, published September 2026: “The next dated entry is already public before its window: October 2026… Whether this one does, you’ll be able to grade it — I publish first, the market grades me, and the follow-up gets written either way.”
Read those again and notice what is not there: a price. No bottom at a number, no rally to a number. That was deliberate, and it is the whole lesson of the scorecard: in my track record the dates kept being right while the price calls attached to them kept being wrong. Time has been my edge. Price has been my humility.
How a time call gets graded
A time call is graded on time. That is the rule on the scorecard and it does not change because the entry is mine.
But “graded on time” needs a measurable question, or it is just a horoscope. So on October 3 — inside the window, before the date, and I am telling you that too — I wrote down the question the grade would answer:
Did a measurable pickup in volatility, or in the signals that precede volatility, coincide with the pre-registered window?
Not “did Bitcoin bottom.” Not “did Bitcoin rally.” A date does not move price on the day; a date marks a window where the clock says the odds of a change in regime go up. The way you see a change in regime first is not in price. It is in volatility — in bonds, in the dollar, in the odds the market puts on the next Fed move, in equity options, and in Bitcoin’s own options.
So the grade below runs gauge by gauge. Price gets its own section, ungraded, and a date for when it will be graded.
The receipts: what the gauges did, September 29 to October 13
Window = October 1–15, 2026, with the Chapter 7 date of October 13 inside it. “Pre-window” = the September 29 close.
| Close date | MOVE (bond vol) | 10-yr yield | 30-yr yield | DXY (dollar) | VIX (equity vol) | BTC DVOL (Bitcoin implied vol) | Bitcoin |
|---|---|---|---|---|---|---|---|
| Sep 29 (pre-window) | 101.8 | 5.22% (Sep 28) | 5.53% (Sep 28) | — | — | 35.5 (Sep 28) | — |
| Oct 2 | 107.3 | 5.33% | — | 102.20 | 15.31 | 36.4 | $86,184 |
| Oct 5 | 113.6 | 5.31% | — | 102.02 | 15.44 | 35.7 | $85,885 |
| Oct 6 | 105.2 | 5.27% | — | 101.83 | 15.01 | 35.8 | $83,910 |
| Oct 7 | 102.6 | 5.33% | 5.71% | 102.39 | 15.65 | 38.7 | $82,978 |
| Oct 8 | 100.7 | 5.25% | 5.62% | 102.09 | 15.22 | 36.6 | $82,511 |
| Oct 9 | 98.5 | 5.24% | 5.60% | 102.23 | 14.84 | 36.7 | $82,829 |
| Oct 12 (bond mkt closed) | — | — | — | 102.59 | 15.21 | 37.8 | $83,691 |
| Oct 13 (Chapter 7 date) | 101.1 | 5.22% | 5.56% | 102.18 | 15.27 | 36.9 | $83,115 |
Sources: ICE BofA MOVE and CBOE VIX closes via public quote feeds; U.S. Treasury yields; ICE Dollar Index; Deribit’s public BTC DVOL index (09:00 UTC reads); CoinGecko daily closes. Every row was captured the morning after the close and logged with its source before this post was written.
The grade, gauge by gauge
Bond-market volatility — HIT, then round-trip. The MOVE index, which measures how much the Treasury market expects to move, jumped roughly 30% in the last week of September — its biggest weekly jump since the April 2025 tariff shock — and then ran from 101.8 at the September 29 close to 113.6 on October 5, the first Monday of the window. The 10-year yield printed 5.33% on October 2 and again October 7 (a level not seen since 2007); the 30-year printed 5.71%. That is a measurable pickup in volatility coinciding with the window’s open. It then round-tripped: by the October 9 close MOVE was back at 98.5, below where it started, and it closed the Chapter 7 date itself at 101.1 — within a point of where it began. The clock rang. It did not keep ringing.
Rate-path volatility — HIT. On October 2 the September jobs report came in at +29,000 and the market’s odds of an October 28 Fed hike went from roughly 70% to roughly 22% in a single print. Whipsaw in what the market expects the Fed to do is volatility, whether or not a price index catches it that day.
The dollar — a level, not a vol event. DXY broke above 102 for the first time since April 2025 and held a 101.8–102.6 range all window. New highs on a trend are not the same thing as a volatility pickup, and I am not going to count them as one.
Equity volatility — MISS. The VIX spent the entire window between 14.8 and 16.4 and closed at a window low of 14.84 on October 9. Stocks did not care.
Bitcoin’s own volatility — MISS. This is the one that matters most for a Bitcoin call, so it gets the plainest sentence: Bitcoin’s implied volatility (DVOL) came into the window already collapsed to its realized volatility — about 35 on September 28 — and stayed between roughly 34.5 and 38.7 the whole window — 36.9 on the Chapter 7 date itself. No expansion. One single-day twitch on October 7 (38.7) that faded by the next close. The signal the window was supposed to light in Bitcoin’s own options did not light.
Grade: PARTIAL — provisional. The volatility arrived on time — in the Treasury market, in the dollar, and in Fed expectations, in the first week of the window. It did not arrive in stocks, and it did not arrive in Bitcoin. The window called the clock, not the asset.
Two things about that grade, because I want you to understand it rather than just read it.
First, the bond and Treasury market signals lead equities and Bitcoin. When a regime is changing, the first place it shows is in rates, in bond volatility and in the dollar — stocks and Bitcoin catch up later. At this window’s opening, those leading gauges were the ones signaling higher volatility ahead. That is not nothing.
Second, a window cannot be fully graded on the day it opens. In February 2026 I could not tell you what price would do either; the date marked something significant, and a war broke out inside its window — it is on the scorecard that way. This window opened with bond volatility, yields and the dollar all rising at once. If the sell-off that Cem Karsan describes below arrives shortly after the election, this grade gets revisited in the February 2027 follow-up. If nothing follows, PARTIAL stands for good.
On the scorecard’s own definitions — HIT (played out as written), PARTIAL (the date or structure worked; the specifics didn’t), MISS (wrong, and said so publicly) — this is a PARTIAL: the date worked, the specifics didn’t. It goes in the file that way, next to the June 2025 PARTIAL.
What price did (not graded — stated)
Because you will ask: Bitcoin opened the window near $83,700, traded up to about $86,400 on October 2–4, drifted down to about $82,500 by October 8–9 on low volatility, and closed the Chapter 7 date at about $83,100 — above its 200-day moving average (about $72,000), which it crossed back above on August 20 and has held since. So the Chapter 7 line about “crossing back above its 200-day” was behind us before the date arrived; the date did not produce a new cross, up or down. What this window may do instead is set up a test of that 200-day line from above — Bitcoin crossed it well before the date, and the chart below shows why I am watching for the test. It is still too early to tell.
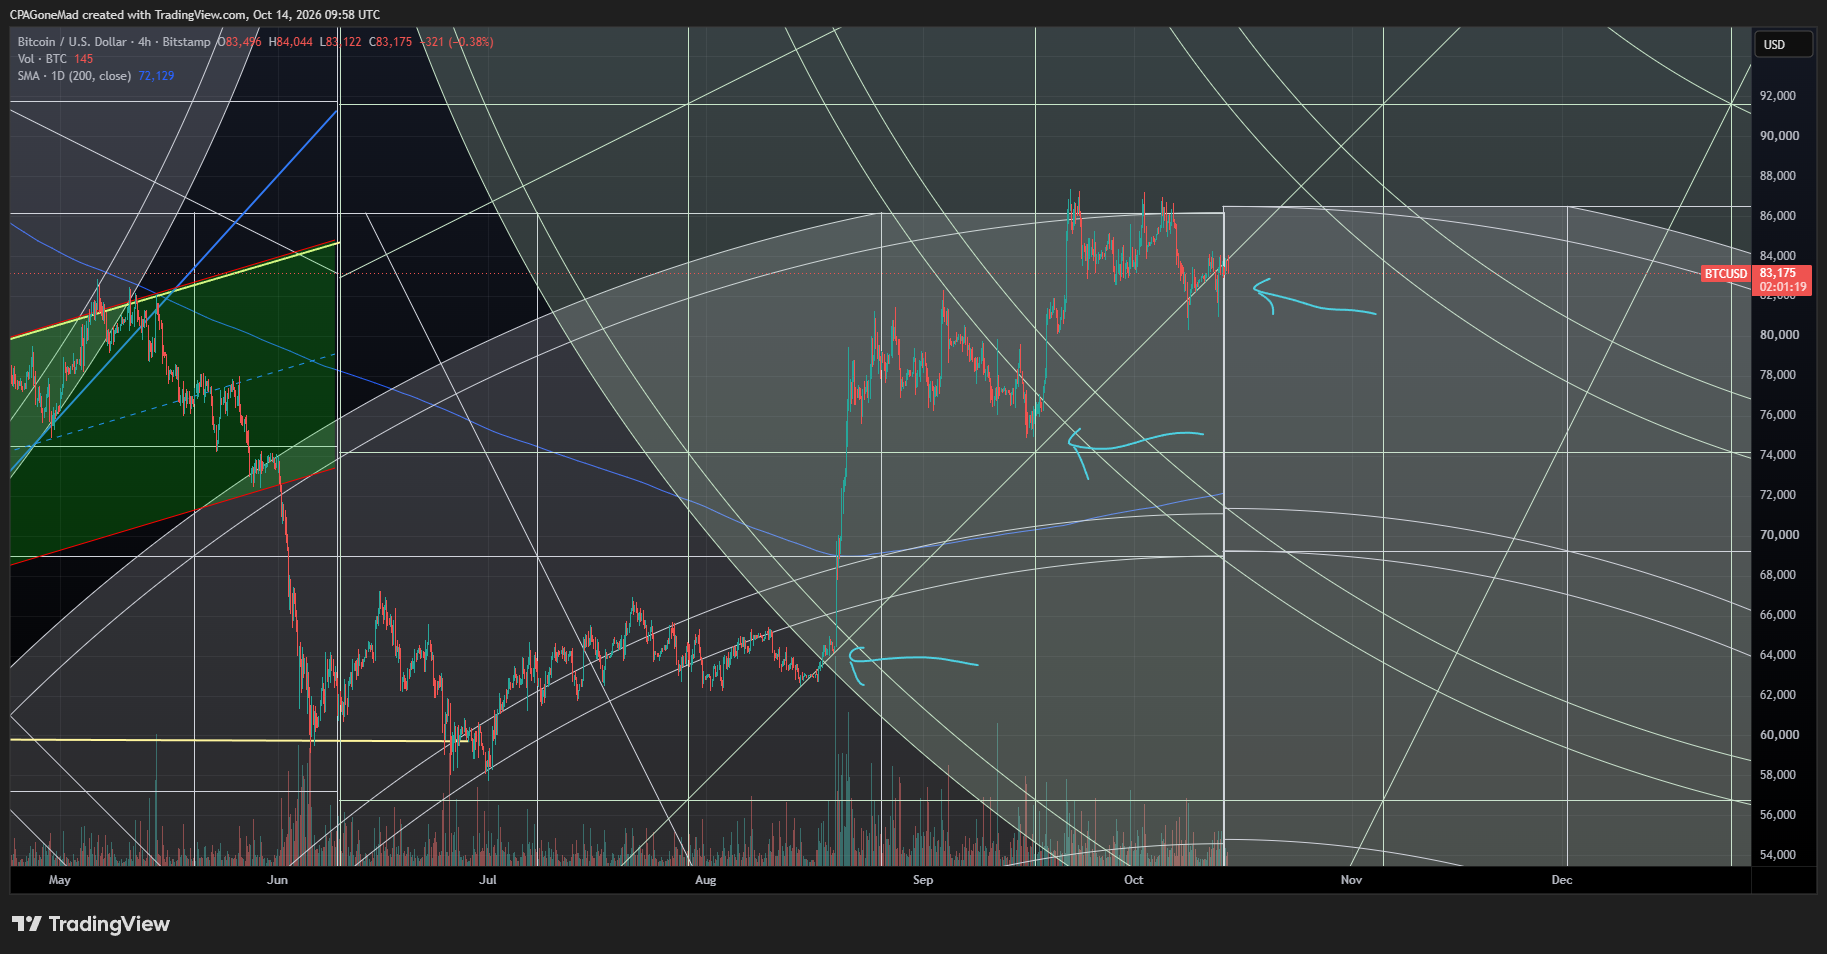
Bitcoin, 4-hour chart (Bitstamp) with the 200-day moving average in blue and my Gann time-and-price lines. Right into the window’s start date, price was testing a key Gann support line for the third time (arrows) — and unlike the first two tests, it did not bounce immediately. Chart: TradingView, October 14, 2026.
None of that is a grade. A price grade on a time window takes months to resolve, and the scorecard’s rule is that history gets graded after it happens, not on the day. The price grade for this window comes at the next dated windows on the record — and I am registering them here, today, before they open: a smaller window in February 2027, and the next major window in June 2027. Neither date is in Book 2 or on the original scorecard; both are new entries as of this post, October 15, 2026, and they get graded the same way — in a follow-up, never by editing this page. My expectation, written down now so it can be graded later: volatility rises from this October window through the June window.
My view from here — labeled as a view, with the case against it
Here is where an analyst usually slides the folder across the table. I am going to show you the drawer too.
The view. October was a window, not a bottom. My read is that the sell-off this window hinted at in the bond market has not happened yet in stocks or Bitcoin, and that the higher-odds period for it is after the November 3 midterms and before next spring — and that if it comes, it comes with a policy response large enough to produce a V-shaped recovery in which Bitcoin would likely outperform. I hold that view. I could be wrong, and I have been wrong about price before, in public, on this website.
Evidence for it (dated, public): – Cem Karsan, Real Vision, September 25, 2026 — before the window opened — argued the structural pressure in the bond market resolves through a sharp, short crisis followed by printing at scale, and that the incentives put it after the midterms rather than before: “You cannot deploy money printing QE at scale at all time highs.” And: “You’re going to have a crisis, by the way. It’s going to be sharp. It’s going to be steep.” His timing (paraphrased): it has to start within months of the midterms, by spring at the latest. Lay his dates over the two windows I just registered — the sharp move after the midterms, resolution by March to June — and they land on February and June 2027. – Darius Dale, September 30 and October 1 on X, framing the same mechanism as a binary: the Fed holding policy loose enough to “agitate” the Treasury market gives the Treasury air cover for a coordinated “Fed-Treasury Accord 2.0” — and “If yes, then stocks, gold, and Bitcoin will SOAR throughout 2027. If no, then we may already be in inning one of the likely pending secular bear market.” Dale has a name for the mechanism, and he has been using it since June: the “Play-Action Pass to Set Up the Run” — the Fed tightens cyclically now in order to ease structurally later. The tightening is the fake; the agitated bond market is what sells it; the run is the coordinated Fed-Treasury response under Warsh, Bessent and Zervos. Karsan’s timing and Dale’s mechanism describe the same play from two seats, and both land inside the windows above. – The dated statements from the top: a $5,000 “dividend” to every adult if the GOP holds Congress (September 28), and “a depression the likes of which we’ve never seen” if it doesn’t (October 1). You do not have to like either sentence to notice that both describe a government prepared to spend at scale on a market event. One could argue that right around this window’s opening, the White House was telegraphing the whole sequence: a market sell-off after the midterms — which a government can bring on simply by letting liquidity dry up, and one macro shop’s latest read already flags a modest near-term liquidity headwind — followed by a “dividend” that reads like the fuel for a V-shaped recovery, the Accord 2.0 that Dale describes and the printing at scale that Karsan describes. That is an argument, not a fact. It is in the file because it is dated and public. – One macro research shop’s cross-asset model flipped to risk-off the same week the window opened and stayed there into the second week — the same week MOVE made its high — and its latest read flags a modest near-term liquidity headwind.
Evidence against it (dated, public): – Bitcoin’s own options never flinched. If a regime change were near, Bitcoin implied vol at 35–38 is not where it usually sits beforehand. – Equity vol at a window low. The VIX at 14.84 is a market pricing calm, not stress. – The rate path moved toward easing, not stress: October hike odds collapsed from ~70% to ~22% on one jobs print, and the bond-vol spike fully reversed within a week. – The same macro shop whose model flipped risk-off keeps a base case of “buy the dips” over the next twelve months. Reasonable people with good models see the sell-off as a buying opportunity inside an uptrend, not the start of something bigger.
Neither column is advice. They are the two sides of the file.
Your homework (not my advice)
If you want to grade the next window yourself instead of taking my word for it, watch three numbers and write them down weekly: the MOVE index (bond volatility), the VIX (equity volatility), and Bitcoin’s DVOL (Deribit’s implied-vol index). A window is working when all three expand together. It is a bond-market story when only the first one does — which is what October 2026 was. And nothing on this page tells you what to buy, sell, or hedge; that decision is yours, with your own numbers in front of you.
The next window gets registered before it opens. The follow-up gets written either way.
Educational content only. Nothing in this post is individual investment, financial, or tax advice. Dates, readings and sources are logged as captured; the original scorecard post is unchanged by design.
Book 2, Accelerate Your Money and Prosper — Kindle $4.99 (Kindle Unlimited) / paperback $14.99 — Amazon. Chapter 7 is where this date was registered.