Every significant Bitcoin correction brings them out. The perma-bears. The “I told you so” crowd. The analysts who have been calling for Bitcoin’s death since it traded for the price of a pizza.
Over the past two weeks, my inbox has filled with bearish research. Robert Prechter’s Elliott Wave Theorist declaring the entire Bitcoin bull market over, with targets of $3,000 or zero. Jim Rickards warning of “a lot more crypto panic.” Greg Diamond at Stansberry tracking Gann dates and seeing a stock market topping process that will drag crypto lower.
I read all of it carefully. I take contrary opinions seriously. That’s how you stress-test a thesis. And I’ll be honest with you: the bearish case has some merit. The wave count Prechter presents is technically valid. The sentiment data he cites is real. The ETF flow analysis is concerning.
But here’s what I’ve learned after years of studying markets: perma-bears are always bearish. That’s their brand. They called for collapse at $1,000, at $10,000, at $20,000, at $69,000, at $100,000. Eventually, every asset has a correction, and when it comes, they declare victory and ignore the 126,000,000% gain they told everyone to avoid.
Let me show you what I mean.
The Prechter Paradox
Robert Prechter deserves respect. I want to be clear about that before I say anything else. In September 2010, his publication The Elliott Wave Theorist featured a two-page writeup on Bitcoin when it sold for six cents. Six cents. He identified an asset that would rise to $126,000, producing a gain of 210 million percent.
That is one of the greatest calls in financial history. I mean that sincerely. The intellectual framework required to identify something that transformative, that early, is extraordinary. Most of us were still figuring out what a blockchain was in 2014. Prechter saw it in 2010.
But here’s where it gets complicated.
Prechter’s firm turned aggressively bearish in December 2017 when Bitcoin hit $20,000. They published articles with headlines like “Bitcoin Risk of Collapse.” They gave video interviews warning of disaster. They told their subscribers to get out.
Bitcoin did fall 84% to $3,136 over the next year. The bears celebrated. The headlines wrote themselves. “We were right!”
Except Bitcoin didn’t stop at $3,136. It consolidated. It built a base. And then it went to $69,000 in November 2021. Then $126,000 in October 2025. Anyone who sold at $20,000 based on that bearish call missed a subsequent 6.3x gain. And anyone who sold at $3,136, thinking the bear thesis was confirmed, missed a 40x gain to $126,000.
Now Prechter is bearish again. His February 13, 2026 issue calls the October 2025 high of $126,000 the END of Bitcoin’s entire bull market from inception. Not a correction within an ongoing trend. The end. His targets: $21,000 at first support, $3,500 at major support. And he explicitly states, “one cannot rule out an ultimate price of zero.”
He writes: “The bear market that emerges should devastate portfolios holding large amounts of bitcoin.”
This is what I call the Prechter Paradox. He made one of the greatest bullish calls in financial history at $0.06, then spent the subsequent sixteen years telling people to sell an asset that rose 210 million percent. The opportunity cost of following his bearish calls since 2017 has been catastrophic, even as the individual calls occasionally caught corrections.
Will he eventually be right about a major bear market? Of course. Every asset has bear markets. If you stay bearish long enough, you will eventually catch one. But what is the cost of that strategy? What do you give up by being positioned for disaster while the greatest asset appreciation in financial history unfolds around you?
That’s the question the bearish research never answers.
The Bearish Case, Presented Fairly
I believe in taking the other side seriously. If you can’t articulate the opposing argument clearly and honestly, you don’t understand the debate well enough. So let me present the bear case as strongly as I can. This is what Prechter, Diamond, Rickards, and others are arguing.
The Five-Wave Completion Thesis
Prechter’s February 13 issue shows Bitcoin tracing out a complete five-wave Elliott Wave impulse structure from its inception in 2009 to the October 2025 high. In his count, Wave 1 peaked around $16, Wave 2 bottomed at $0.45, Wave 3 peaked at $20,000 in December 2017, Wave 4 bottomed at $3,136 in December 2018, and Wave 5 peaked at $126,000 on October 6, 2025.
If this count is correct, the implications are severe. A completed five-wave impulse from inception means the entire structural bull market is over. Not a correction within an ongoing bull market. The end. The subsequent bear market should retrace a significant portion of the entire advance. The only Elliott Wave support Prechter identifies sits at the Wave 4 of Wave 3 low around $3,233.
This is not a fringe argument. The wave structure he presents is internally consistent. The proportions between waves are reasonable. A competent Elliott Wave analyst looking at the chart could arrive at this count. I want to be honest about that.
The Sentiment Data
Prechter cites a poll conducted on February 12 by coinmarketcap.com asking Bitcoin investors whether they were bullish or bearish. The poll received 6.1 million responses. The result: 80% bulls, 20% bears.
His conclusion: “By that statistic alone, we can conclude that the bitcoin bear market is nowhere near over.” His logic is straightforward. True bottoms require sentiment capitulation. Bears must outnumber bulls. Hopelessness and despair must dominate. If 80% of investors are still bullish after a 51% decline from the highs, the selling is far from finished.
The ETF Underwater Problem
James Bianco’s research shows that the average cost basis for all Bitcoin ETF purchases since inception is approximately $90,200. With Bitcoin trading around $64,000 to $67,000 at the time of his analysis, the average ETF holder was sitting on a 25-30% unrealized loss.
These holders have not sold yet. When they do, whether from margin calls, fund redemptions, tax-loss harvesting, or simple loss aversion capitulation, it will create another wave of selling pressure. And the timing data is particularly damning: the largest single-day inflow into Bitcoin ETFs occurred on October 6, 2025. The exact top. Investors bought the mania most heavily on the very worst day possible. As of February 5, 2026, ETF holders were down a collective $15.97 billion, representing a 41.1% decline from their aggregate cost basis.
The Stock Market Correlation
Greg Diamond’s analysis from February 17 identifies potential Wave 5 completions in VTI, XLI, and SMH. If equities are topping and entering their own bear market, Bitcoin will not decouple. It will accelerate lower.
Prechter makes this argument explicitly: “Since its debut in 2009, bitcoin has roughly tracked the S&P Composite index. But bitcoin topped more than five weeks ago, on October 6, and has been slipping since. I think bitcoin is leading the way.” The implication is that Bitcoin is not merely in its own correction. It is the canary in the coal mine, leading the entire stock market into a structural decline.
The Gann Date Interpretation
Diamond tracked the February “natural” Gann dates from February 9 to 12 and identified an inflection point. Looking at the four-hour chart from the week of February 10, price peaked right at that window, topping around $73,000 before pulling back. Diamond writes: “We tracked the February ‘natural’ Gann dates from February 9 to 12 and pinpointed an inflection point.” If the Gann date marked a top rather than a launch point, the bearish interpretation gains credibility.
I take all of this seriously. These are smart people making arguments grounded in real data. Dismissing them would be intellectually dishonest.
Now let me show you why they’re wrong.
Bitcoin 2-hour chart showing the Elliott Wave count from the $126,000 top. This is the decline structure the bearish camp is citing.
Why the Bears Are Wrong (Again)
The Wave Count Is Not the Only Valid Interpretation
Prechter counts the October 2025 high at $126,000 as Wave 5 of the entire structure from inception. But this is not the only valid Elliott Wave interpretation, and this is something the bearish research conveniently omits.
Consider an alternative count that is equally consistent with the price data. The 2017 high at $20,000 could represent Wave 1 of a larger-degree structure. The 2018 low at $3,136 could be Wave 2. The 2021 high at $69,000 could be Wave 3. The 2022 low at $15,500 could be Wave 4. And the 2025 high at $126,000 could be Wave 5 of Wave 3 of the larger structure, meaning Wave 4 and Wave 5 of the larger degree are still ahead, with ultimate targets far above $126,000.
Under this count, the current decline from $126,000 is Wave 4 of the larger structure, which would typically retrace 38.2% to 50% of Wave 3. A 50% retracement of the move from $15,500 to $126,000 targets approximately $70,750. We already hit $59,600 on February 3. The correction may be complete or very nearly so.
This is the fundamental problem with using Elliott Wave analysis as the sole basis for a directional call. It is an art, not a science. Two competent analysts can examine the same chart and derive completely different counts. Prechter’s count leads to $3,000 or zero. My count leads to $170,000 to $250,000 or higher. The wave structure itself does not definitively support either view. Our interpretive frameworks determine our conclusions, and our frameworks are shaped by our biases.
I am not saying Prechter is wrong and I am definitely right. I am saying the wave count is ambiguous, and presenting one interpretation as the only valid reading is misleading.
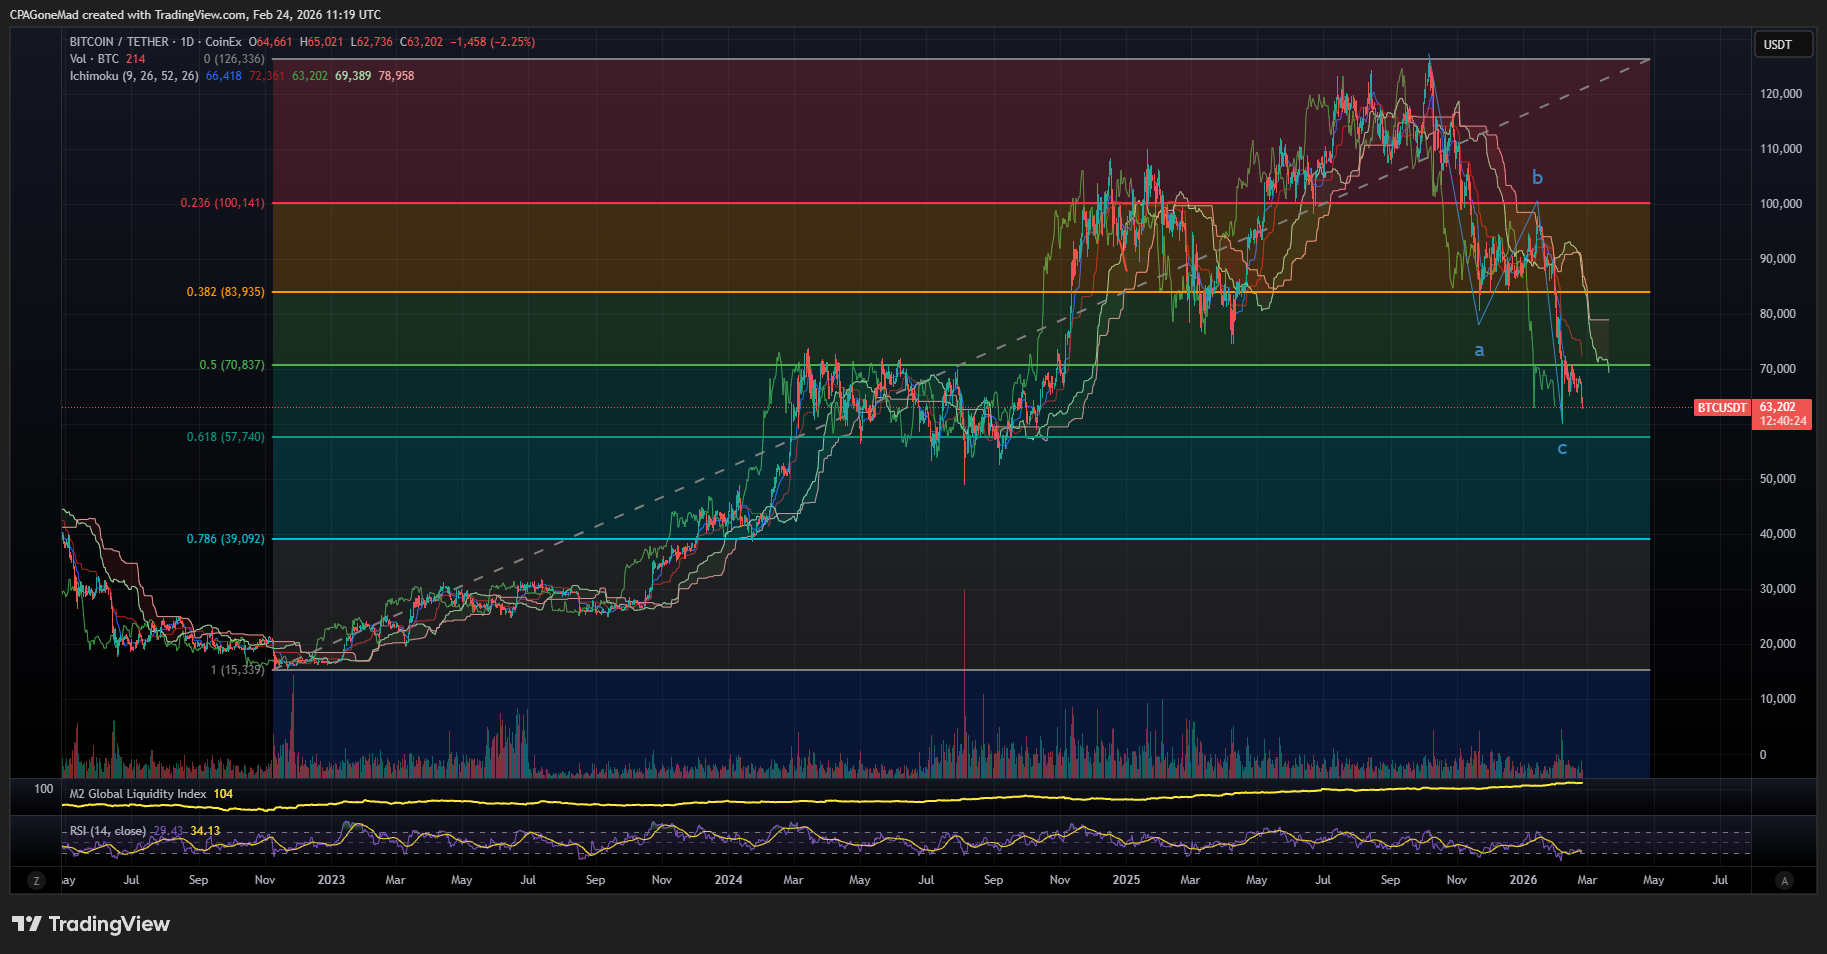
Bitcoin weekly chart with Fibonacci retracement levels. Price currently sits in the 50% to 61.8% retracement zone — the textbook area where Wave 4 corrections find support.
The 80% Bulls Statistic Is Selection Bias
This is the argument that bothers me the most, because it sounds compelling but falls apart under scrutiny.
Prechter cites a coinmarketcap.com poll showing 80% bulls among Bitcoin investors. But think carefully about what that poll actually measures. It is asking people who still hold Bitcoin, who are still visiting coinmarketcap.com, who are still engaged enough to respond to a poll, whether they are bullish or bearish.
Of course they are bullish. That is why they are still holding. That is why they are on coinmarketcap.com. The people who turned bearish already sold. They are not hanging around cryptocurrency websites taking polls. They are watching Netflix and congratulating themselves on getting out. The 80% bulls stat does not measure market sentiment. It measures survivor bias among committed holders.
The more relevant sentiment measures tell a completely different story. The Fear and Greed Index hit 5 during this decline, which is extreme fear territory that has historically marked bottoms, not the beginning of sustained bear markets. The Financial Times published a piece on February 10 calling Bitcoin “$70,000 too high,” arguing it is worth literally zero. That is classic magazine cover indicator behavior. You see those kinds of extreme consensus articles at turning points, not in the middle of a trend. Bitcoin ETFs have seen sustained outflows for weeks. Social media sentiment has collapsed.
The marginal buyer, the participant who actually determines price at the margin, has capitulated. The 80% bulls are the diamond-hands holders who held through 2022’s 77% decline and will hold through anything. They are not the ones setting price. Confusing their conviction with market sentiment is a fundamental analytical error.
The ETF Data Cuts Both Ways
Yes, the average ETF holder is underwater at a $90,200 cost basis. Yes, that creates potential selling pressure. But consider the other side of this trade.
Over $100 billion is sitting in those ETFs with holders who bought because they believe in Bitcoin’s long-term thesis. These are not day traders who will panic at the first red candle. They are wealth managers who added one to two percent Bitcoin exposure because BlackRock told them it was “reasonable.” They are pension funds with ten-year horizons. They are long-term holders using the ETF wrapper for tax efficiency and custody simplicity.
Will some of them capitulate? Probably. Some already have, which is partly what drove the decline to $59,600. But forced selling from this cohort is more likely to create a buying opportunity than a sustained bear market. When conviction capital from institutions sits available to absorb panic selling from weak hands, bottoms form. That is how markets work.
And here is the point the bears skip over entirely. The ETF holders who purchased at an average of $90,200 already watched Bitcoin fall to $59,600. That is a 34% unrealized loss from their cost basis. They did not sell. If they were going to panic, that was the moment. The fact that they held through a one-third drawdown suggests the forced selling thesis is considerably weaker than the bearish research implies. The weak hands have already been flushed. What remains is conviction capital.
The Macro Regime Does Not Support Deflation
Prechter’s framework is fundamentally deflationary. His Grand Supercycle thesis calls for a collapse in credit, asset prices, and economic activity. For Bitcoin to fall to $3,000 or zero, this deflationary collapse must not just begin, it must overwhelm every countervailing force in the global financial system.
Look at what is actually happening in the macro environment right now.
The Federal Reserve ended quantitative tightening on December 1, 2025. They began Reserve Management Purchases on December 12. They have been cutting rates. M2 money supply is expanding, not contracting. The M2 Global Liquidity Index sits at 104 and is rising.
The dollar is breaking down, not strengthening. DXY has fallen below 100 for the first time since 2022. In a deflationary collapse, the dollar strengthens violently as everyone scrambles for cash. That is not happening. The opposite is happening.
The 10-year Treasury yield sits at 4.17% and is trending lower. The bond market is pricing in accommodation, not tightening. The ISM manufacturing index surged to 52.6 in January, the biggest one-month jump since the COVID recovery. Above 50 means expansion. The economic engine is turning over, not seizing up.
For Prechter’s targets to be reached, this entire macro regime must reverse. The Fed must pivot back to tightening. M2 must contract. The dollar must spike higher. None of that is on the horizon. In fact, the opposite is coming. The administration faces November 2026 midterms. They need visible economic improvement by mid-year. The political incentive to flood the system with liquidity, through eSLR exemptions, TGA drawdowns, fiscal stimulus, and additional rate cuts, has never been stronger. You do not get deflation when every political incentive points toward stimulus.
The Time and Price Symmetry the Bears Ignore
This is the technical argument that the bearish research completely omits, and it is one of the most important.
In the decline from $126,000, Wave A fell from approximately $126,000 to $81,000. That is a drop of $45,000, or 35.85%, over 46 days. Wave B then rallied back to approximately $100,000 before rolling over. Wave C fell from $100,000 to approximately $59,600.
Here is what is remarkable about that Wave C decline. It traveled a similar percentage, 38.84%, in exactly half the time: 23 days versus 46 days for Wave A. That is a near-perfect Fibonacci time relationship. Wave C completed in half the time with a similar percentage loss.
This is textbook Elliott Wave corrective behavior. In a correction, Wave C often equals Wave A in price magnitude but completes in less time. The structure accelerates to completion. It exhausts itself.
If this were an impulsive Wave 3 down, which is what Prechter’s count requires, it should be extending and accelerating. Impulsive waves do not decelerate. They build momentum. They expand in both price and time. What we are seeing is the exact opposite: a decline that compressed and finished faster. That is the signature of a corrective wave nearing completion, not an impulsive wave just getting started.
The Correlation Argument Cuts Both Ways
Prechter says Bitcoin is “leading the way” lower and stocks will follow. But consider the recent history. Bitcoin bottomed in November 2022 at $15,500 and led stocks higher through 2023 and 2024. The S&P 500 made new all-time highs following Bitcoin’s lead upward.
If Bitcoin leads, and if my reading of Bitcoin’s corrective structure is correct, the implication is that stocks are about to rally, not crash. The correlation argument works in both directions. You cannot cherry-pick the direction that supports your thesis and ignore the direction that undermines it.
And here is an important detail: Bitcoin topped on October 6, 2025. Stocks made new highs in January 2026, more than three months later. If Bitcoin were truly leading stocks into a structural decline, stocks should have topped in October too. They did not. The correlation broke down, which suggests Bitcoin’s decline is a Bitcoin-specific correction, consistent with my Wave 4 interpretation, rather than a leading indicator of systemic collapse across all risk assets.
Government Support Is Foundation, Not Contrary Indicator
Prechter argues that federal support for Bitcoin signals a top because, in his words, government is the last institution to embrace trends. This sounds clever and it makes for good copy. But it does not hold up historically.
Government support for the internet in the 1990s through infrastructure spending and regulatory frameworks did not signal the end of technology innovation. It created the foundation for two more decades of transformative growth. Government endorsement of equity ownership through 401k and IRA expansion in the 1980s did not end the stock bull market. It extended it for decades by bringing millions of new participants into the market.
The Strategic Bitcoin Reserve, the regulatory clarity from the CLARITY Act and GENIUS Act, the OCC allowing banks to custody crypto assets: these are not signs of a top. They are the foundation for the next phase of institutional adoption. The insurance companies, pension funds, endowments, and sovereign wealth funds that require regulatory clarity before making allocations are now getting it. The infrastructure for trillions of dollars in institutional capital to flow into Bitcoin is being built right now.
We are at the beginning of institutional adoption, not the end of it.
Where We Stand Today
Updated February 24, 2026
When I first drafted this analysis on February 17, Bitcoin had peaked around $73,000 at the February 10 Gann date window and pulled back to $67,725. I noted at the time that the pullback did not have impulsive character and identified $64,000 to $65,000 as key support, with $59,600 as the line in the sand.
A week later, price has broken through that $65,000 support. Bitcoin trades at approximately $63,200 this morning. I have to be straightforward with you: the level I flagged did not hold. The bears scored a point.
But before anyone takes a victory lap, let me show you what the charts are telling us. In Elliott Wave analysis, how price arrives at a level matters as much as the level itself.
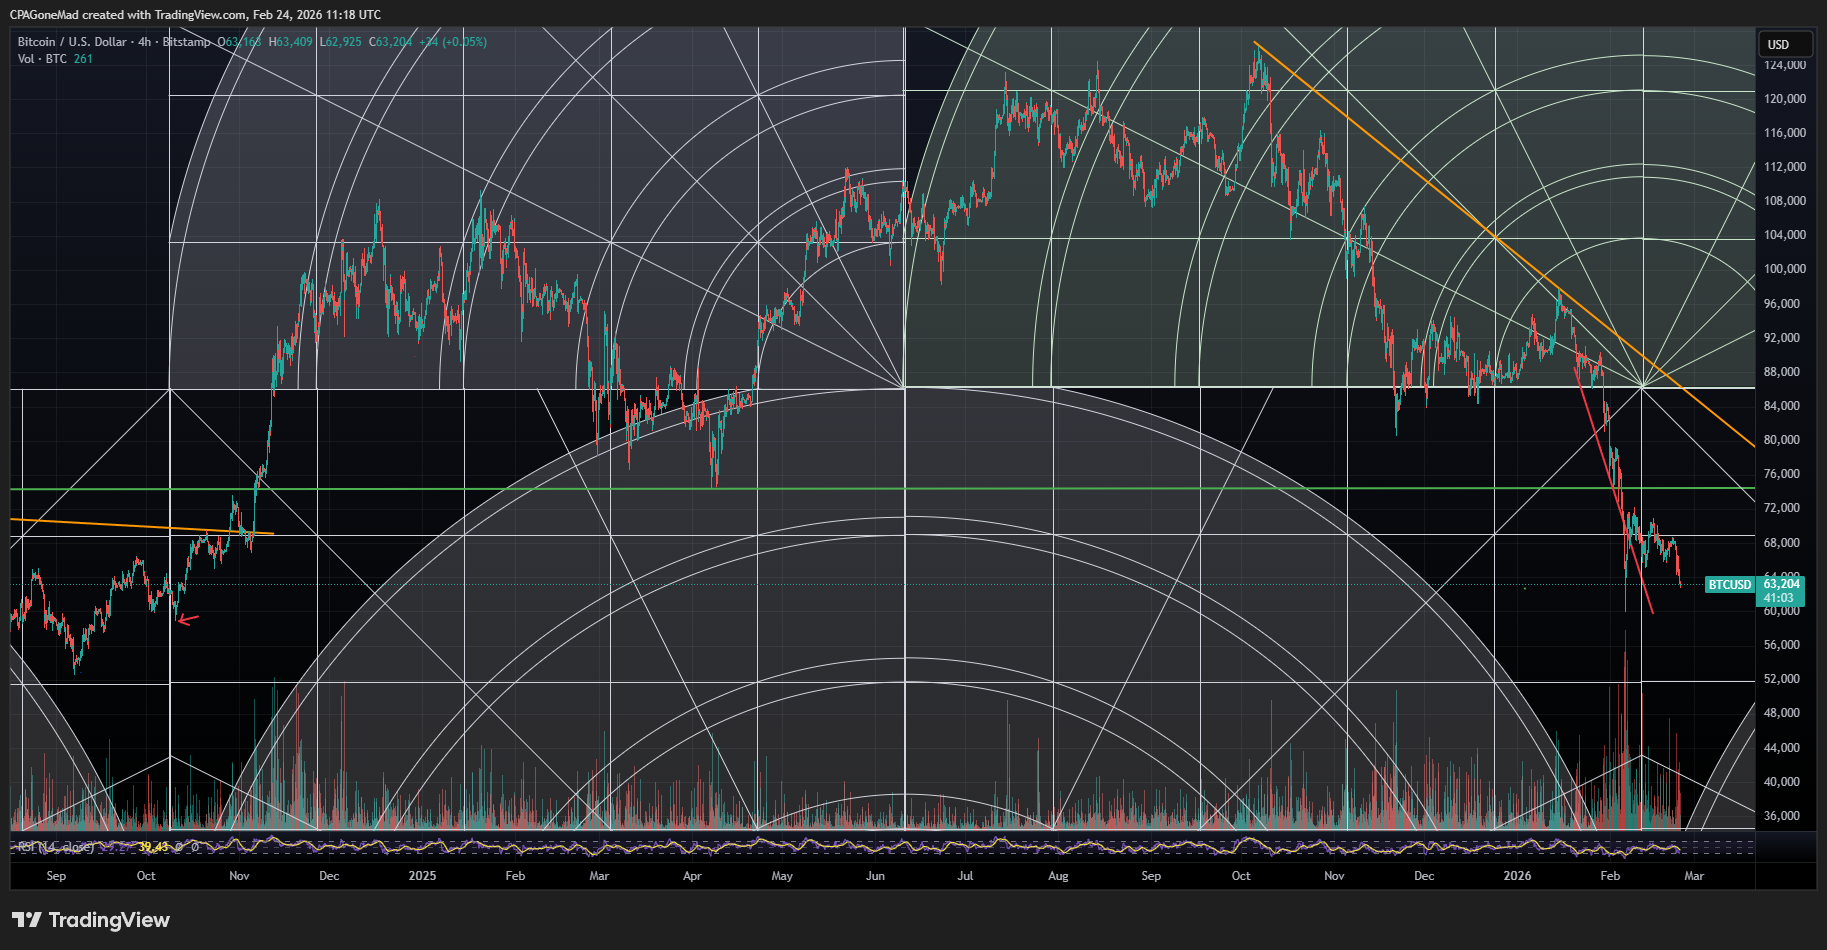
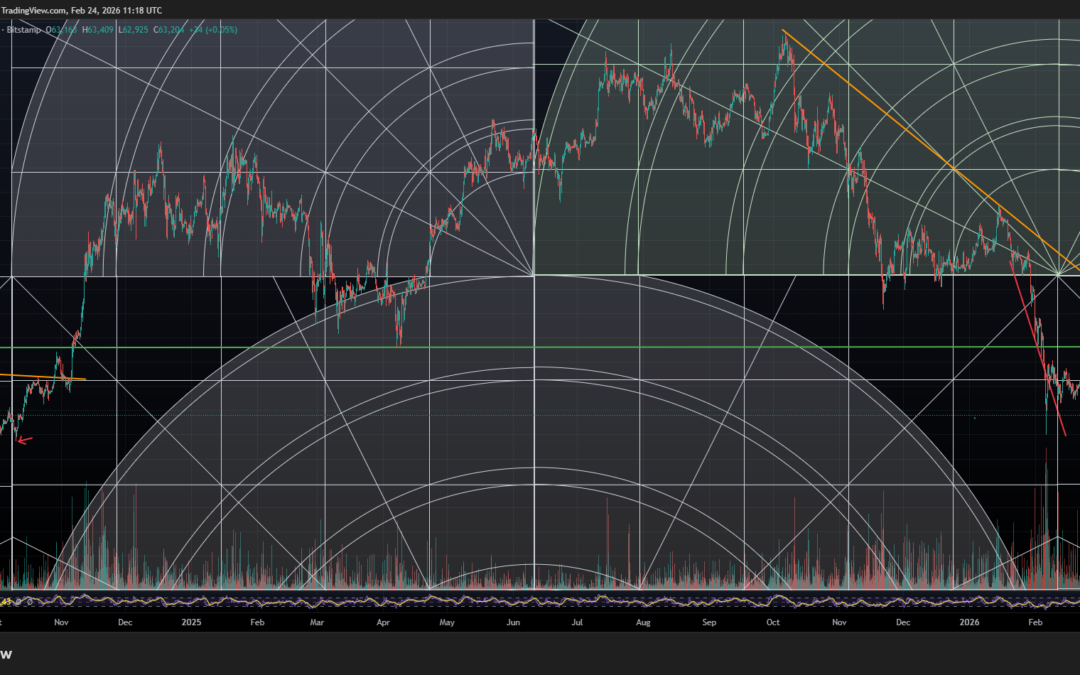
Bitcoin daily chart with Gann geometric time and price analysis, February 24, 2026.
The Gann geometry shows price approaching a critical confluence of time and price support. We are now two weeks past the February 10 date. In the October 2024 analog, it took approximately 30 days for price to break above the downward-sloping Gann angle and confirm the new uptrend. If that pattern holds, we are looking at March 10 to 12 for confirmation — exactly two weeks from now.
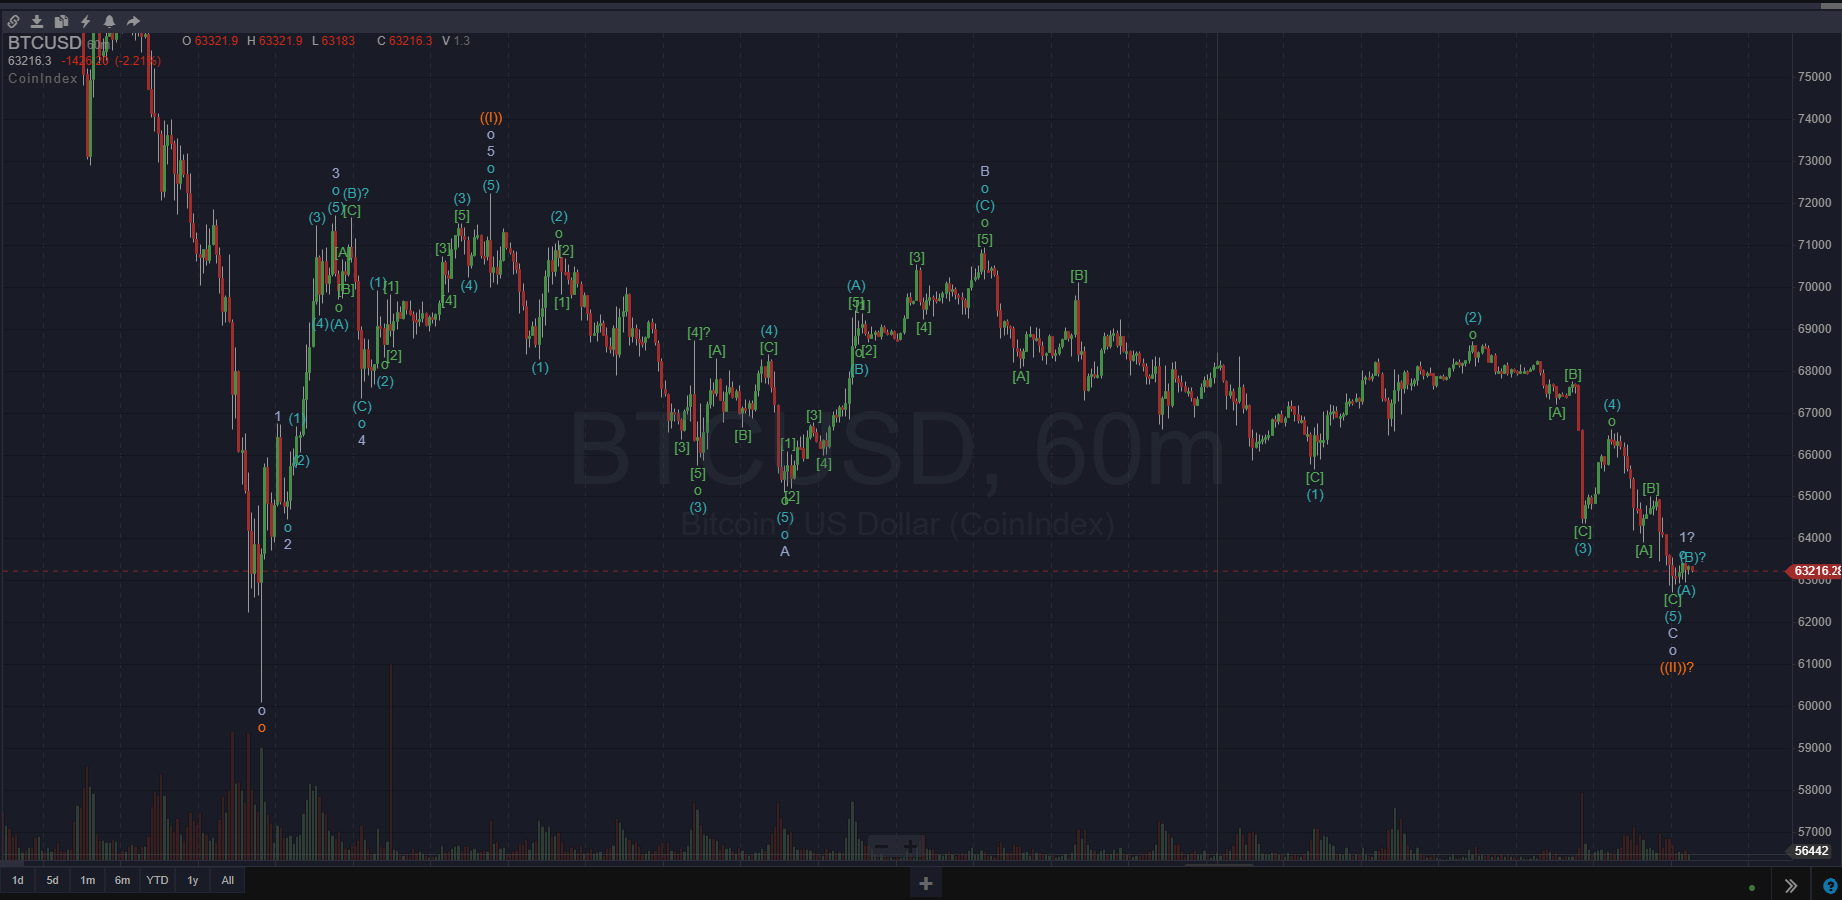
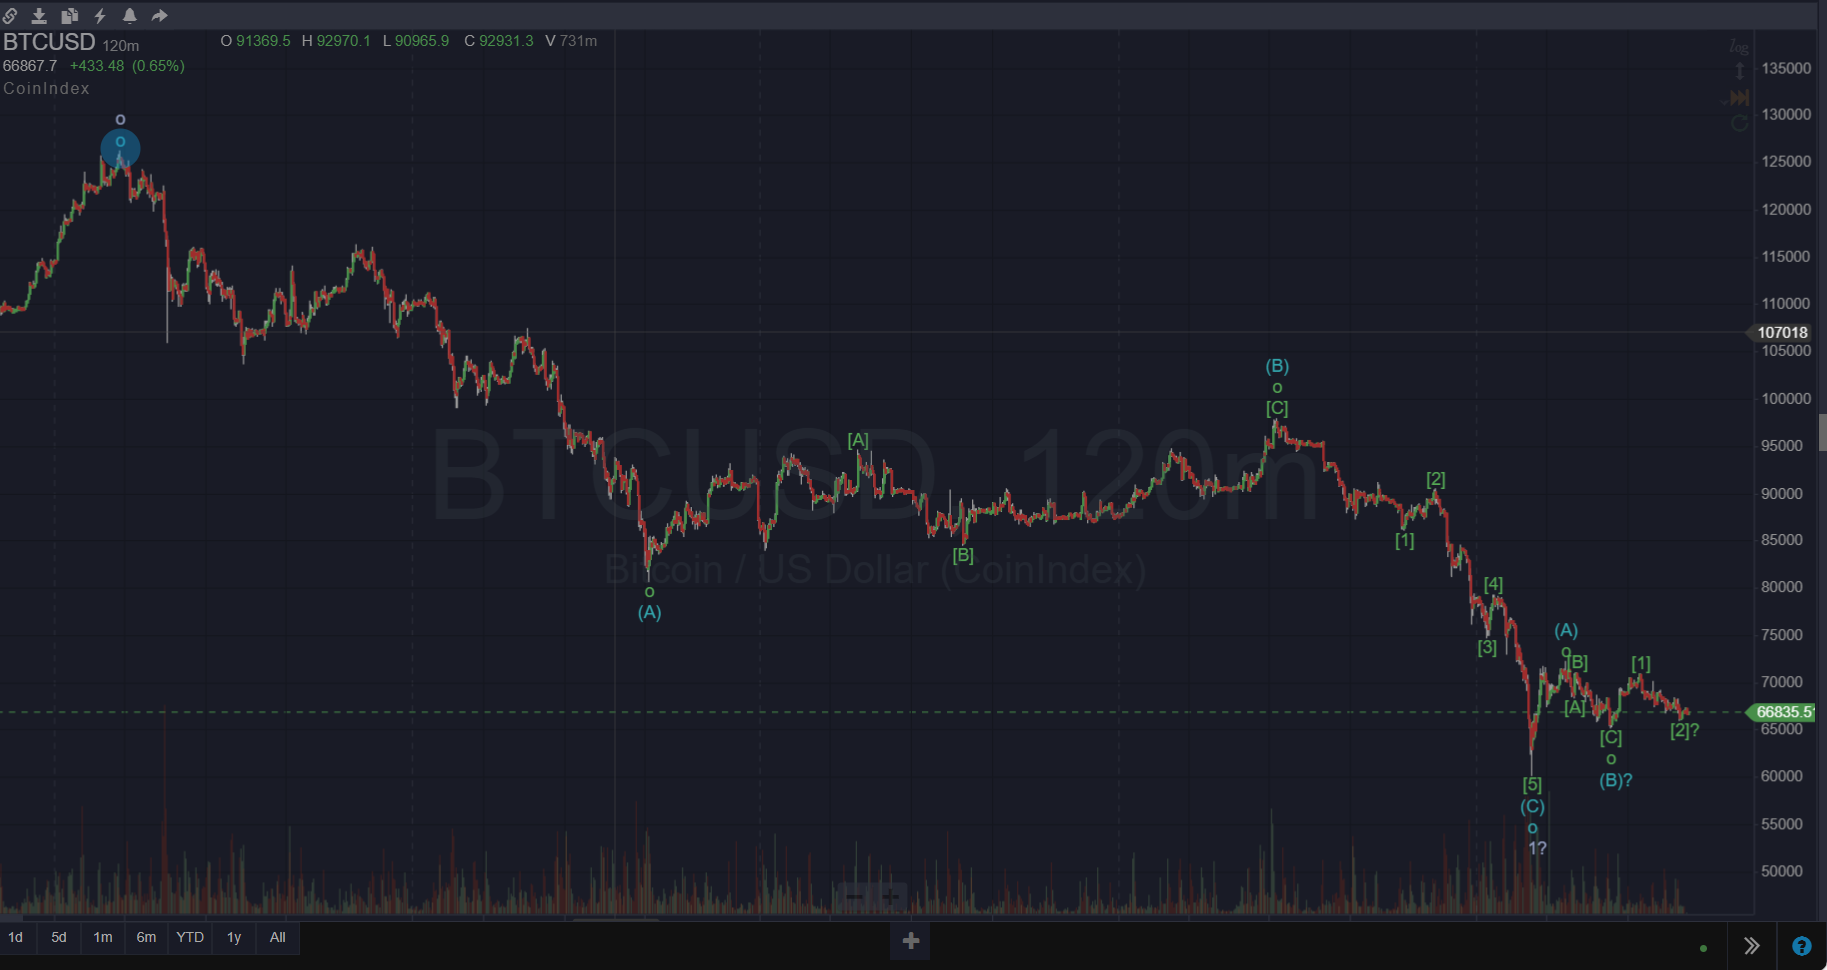
Bitcoin hourly chart from the February 3 low. The ((II))? label at the lower right suggests a corrective Wave II may be completing.
This is the chart that matters most right now. The hourly wave count from the February 3 low shows the rally from $59,600 to approximately $75,000 tracing out what appears to be a five-wave impulse — Wave ((I)). The decline from $75,000 to current levels is unfolding as a corrective A-B-C Wave ((II)), with internal three-wave subdivisions visible on the hourly timeframe.
Look at the character of this decline. It is overlapping, grinding, and decelerating — exactly what corrective waves look like. If this were an impulsive Wave 3 down, which is what the bearish count requires, it should be accelerating, expanding in momentum, and breaking support levels with violence. That is not what we are seeing.
The current price of $63,200 puts us approximately $3,600 above the February 3 low of $59,600. That is the line in the sand. If Wave ((II)) holds above that level and completes here or slightly lower, Wave ((III)) should launch with force — and third waves are the most powerful waves in Elliott theory.
I am not going to sugarcoat it: sitting $3,600 above your invalidation level is not comfortable. But the wave structure, the Gann timing, and the Fibonacci support all converge near current levels. This is either the launch point or the breakdown point. The next two weeks will tell us which.
The Perma-Bear Problem
Here is what fundamentally bothers me about perpetually bearish analysis: there is never any accountability for opportunity cost.
Let me illustrate this with real numbers.
| Event | Price | If You Held $10,000 from $0.06 |
|---|---|---|
| Prechter recommends Bitcoin | $0.06 | $10,000 invested |
| Prechter turns bearish | $20,000 | $3,333,333,333 |
| Bitcoin falls (bears “right”) | $3,136 | $522,666,667 |
| Bitcoin recovers | $69,000 | $11,500,000,000 |
| Bitcoin peaks | $126,000 | $21,000,000,000 |
| Bitcoin today | $63,000 | $10,500,000,000 |
| Prechter’s target | $3,000 | $500,000,000 |
If you followed Prechter’s 2010 call and bought at $0.06, then followed his 2017 call and sold at $20,000, you turned $10,000 into $3.3 billion. That is extraordinary. But you left approximately $7.9 billion on the table at the October 2025 peak. The opportunity cost of the bearish call exceeded the realized gain.
Now Prechter says sell at $63,000 with a target of $3,000 or zero. If he is wrong again and Bitcoin reaches $500,000 in the next cycle, what is the opportunity cost of that call for someone who follows it?
This is the perma-bear problem distilled to its essence. If you stay bearish long enough, you will eventually be right. Every asset has corrections. Every bull market has pullbacks. And when the bear market arrives, you can say “I called it” and conveniently ignore all the gains you told people to miss along the way.
The bears were “right” about Bitcoin at $20,000 when it fell to $3,136. But it was still up 52 million percent from $0.06. And it subsequently rose to $126,000. Being right about a correction within a mega bull market is not the same as being right about the trade. The trade is about net outcome over time, and the net outcome of perpetual bearishness on Bitcoin has been catastrophic wealth destruction through missed opportunity.
How We Will Know Who Is Right
I laid out specific criteria in my original analysis. Let me be accountable.
I said price should hold above $64,000 to $65,000. It did not. The bears scored a point, and I acknowledge it.
But I also said the character of the move matters more than any single level. And I said $59,600 is the true line in the sand. That level still holds. Here is the updated scorecard.
The bears are right if price breaks below $59,600 on expanding volume, the subsequent bounce is corrective and choppy, and the decline accelerates from there. If $59,600 breaks, my Wave ((II)) interpretation is invalidated and Prechter’s first target of $21,000 comes into play. If that happens, I will say so publicly. I do not hide from bad calls.
My thesis holds if price holds above $59,600 and the Wave ((II)) correction completes near current levels. The rally from wherever we bottom should be impulsive: five waves, expanding momentum, breaking resistance levels cleanly. Price should reclaim $68,000, then $73,000, and then $81,000, which is the Wave A low. By the Gann confirmation window around March 10 to 12, price should be above the downward-sloping Gann angle and accelerating. By the end of Q1 2026, we should be challenging $90,000 to $100,000.
The planetary alignment window from February 17 to 20 brought additional downside pressure, as I warned was possible. The lunar eclipse on March 2 to 3 is the next key inflection date. The Gann confirmation window of March 10 to 12 is now just two weeks away.
We are approaching a binary resolution point. Either the corrective Wave ((II)) completes and Wave ((III)) launches, or $59,600 breaks and the structural bear thesis takes over. The next two weeks will settle this.
This is what separates analysis from ideology. I am making specific, time-bound predictions that can be proven right or wrong within weeks. The perma-bears make the same directional call at every price level and wait for the inevitable correction to claim victory. One approach is falsifiable. The other is unfalsifiable. You should be deeply skeptical of any analysis that can never be proven wrong.
Why I Remain Bullish
Despite the continued price decline and the bearish research flooding my inbox, my thesis has not changed. Let me tell you why.
The internal structure of the decline from $126,000 is corrective, not impulsive. Wave C completed in exactly half the time of Wave A with a similar percentage decline. That is textbook Elliott Wave corrective behavior, and it is inconsistent with the beginning of a structural bear market.
The macro regime supports risk assets. The Fed is easing. M2 is expanding. The dollar is falling. Yields are declining. The ISM is above 50. This is the mirror opposite of the environment required for Prechter’s deflationary collapse thesis to play out.
The time and price symmetry with the October 2024 Gann date mirrors what I am seeing now. Different character, a fast V-shaped decline versus a slower consolidation, which suggests a different resolution, but both should resolve higher. The October analog took approximately 30 days to confirm. We are two weeks in, and while the additional decline this past week tested the thesis further, the corrective internal structure remains intact.
The sentiment data, when properly interpreted, shows capitulation among the marginal participants who actually set price. The Fear and Greed Index hit 5. The Financial Times published a death knell article. ETF outflows have been sustained. The 80% bulls statistic that Prechter cites measures nothing more than the conviction of committed holders who are not going to sell regardless. They are not the marginal price setters.
The divergence between RSI at 28.59, which is deeply oversold, and the M2 Global Liquidity Index at 104, which is rising, must resolve. Either global liquidity must reverse lower, or Bitcoin’s price must catch up to liquidity. The macro data gives me no reason to believe liquidity is reversing. Price should catch up.
Government support and regulatory clarity are building the foundation for the next phase of institutional adoption. They are not the contrary indicator the bears claim. The smart money is not selling because the government got involved. The smart money is building the rails for the next trillion dollars of capital to enter this market.
The Opportunity Cost of Fear
Robert Prechter is a brilliant analyst who made one of the greatest calls in financial history. He will eventually be right about a Bitcoin bear market. So will every other perma-bear. Eventually, some correction will be severe enough that they can point to it and say they warned everyone.
But at what cost?
If you sold Bitcoin at $20,000 in 2017 on Prechter’s call, you missed a 6.3x gain to $126,000. If you sell now at $63,000 and Bitcoin goes to $500,000 in the next cycle, you will miss nearly an 8x gain. If Prechter had simply held from his $0.06 recommendation and done nothing else, that single call would be worth more than almost any trading strategy in human history.
The perma-bears have been calling for Bitcoin’s death since $100. They were “right” about every correction along the way. They called the 2014 crash, the 2018 crash, the 2022 crash. They will call the next crash too. And through all of that calling, all of that warning, all of those newsletters and research reports and interviews, they told their followers to avoid an asset that has gained 126 million percent since inception.
I would rather be wrong about timing and right about direction than the reverse. The opportunity cost of fear is the most expensive cost there is.
The next two to three weeks will tell us whether this correction is complete. I have laid out my thesis, my targets, and my specific invalidation levels. The bears have laid out theirs. The market does not care about either of our opinions. It will go where the data takes it.
Let’s see who is right this time.
Disclaimer: Not financial advice, educational purposes only. The views expressed in this article are my personal opinions based on my own research and analysis. I am not a registered financial advisor. Nothing in this article should be construed as a recommendation to buy, sell, or hold any asset. Do your own research and consult with a qualified financial professional before making any investment decisions.