
By Chad Walker, CPA | February 12, 2026
Two weeks ago, in my article “You Are NOT Prepared,” I showed you a chart that scared me. An hourly wave count that suggested Bitcoin could be in the middle of a massive third wave down, targeting the $28,000–$30,000 range. I told you the truth about what I saw. I showed you the chart that argued against my thesis. And I admitted that it worried me.
Today I am going to tell you why that fear was wrong. Not because I want to be right. Because the evidence says so.
In that same article, I also wrote about how we would know within two to three weeks whether the bullish or bearish case was correct. That window is now open. The next two to three weeks will put the score on the board. Either we get an impulsive five-wave rally that confirms the A-B-C correction is complete, or we get a corrective three-wave bounce that fails, confirming the bearish count.
The market will tell us. We do not have to guess. But I want to walk you through why the evidence is stacking up heavily on one side, and what the implications are if I am right. Because if I am right, what is coming next could be the most explosive move in Bitcoin‘s history.
Let me show you the work.
The Count That “Scared Even Me” — And Why It Was Forced
Let me take you back to what I wrote on February 2, 2026. I was staring at an hourly chart that showed what looked like a developing Wave 3 down with nested sub-waves. I labeled waves (1), (2), then [1], [2], [3], [4], with price near $74–$75k potentially forming wave (3) of that larger decline.
I wrote this, and I meant every word of it:
“Here’s why this should scare me: If this is a third wave of a larger impulsive decline, I could be in the early-to-middle stages of the most powerful wave in Elliott Wave theory. Wave 3s are the longest and most violent. A typical wave 3 extends 1.618 times the length of wave 1. If wave 1 was roughly $125,000 to $81,000 (about $44,000), a 1.618 extension from the wave 2 high of $99,000 would target somewhere in the $28,000–$30,000 range.”
That count was technically valid on the hourly timeframe. I was not making it up. The sub-waves were proportional. The corrective waves were shallow. The selling was relentless. On the hourly chart, you could absolutely make the case that we were in the teeth of a third wave down.
But here is what I have learned since then, and it is one of the most important lessons in Elliott Wave analysis: when you have to force a five-wave count on a lower timeframe, and it does not look right when you zoom out to higher timeframes, trust the higher timeframes. Every time.
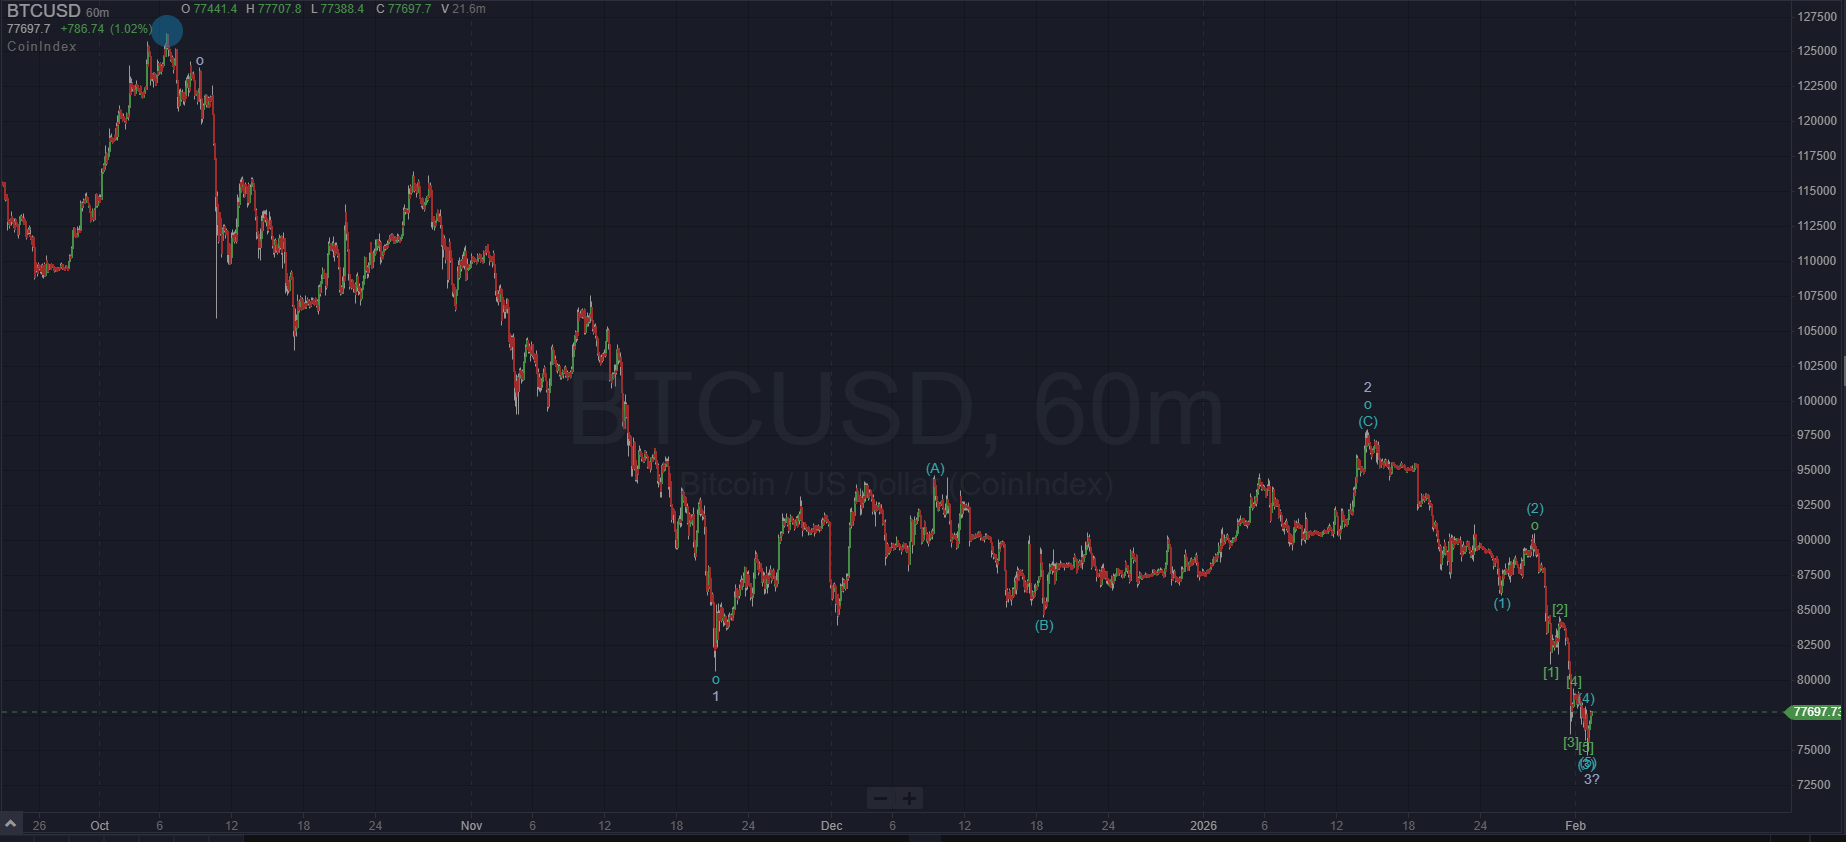
Look at that hourly chart above. You can see the labels I placed. You can see why the count looked threatening. But now let me show you what happens when you step back.
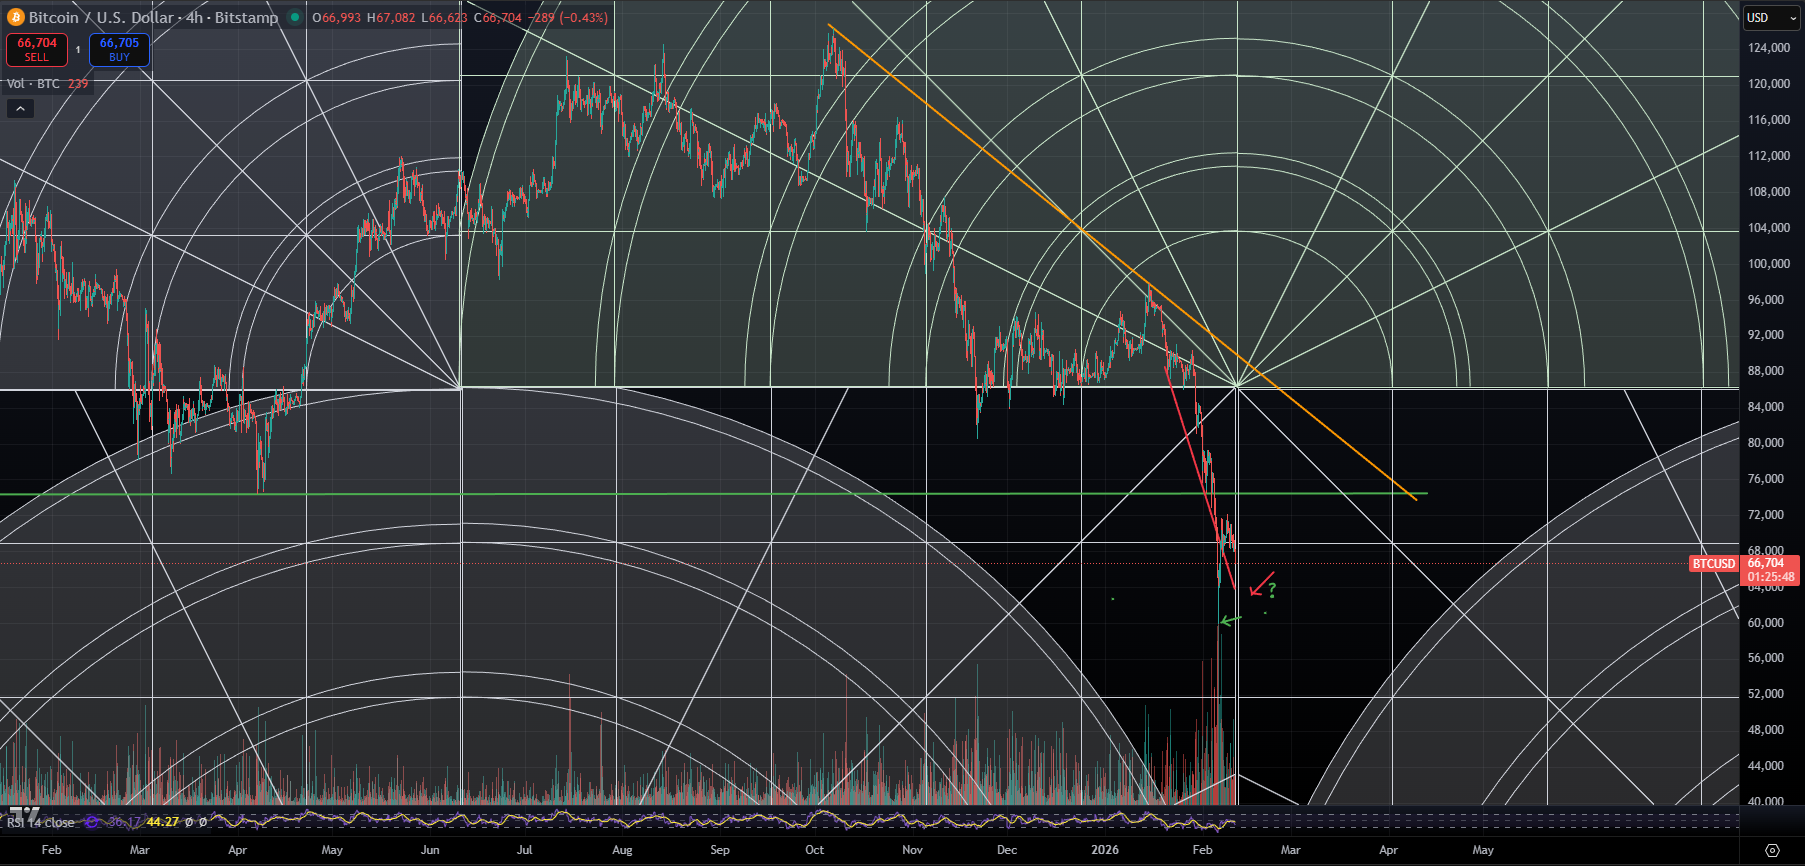
The 4-Hour and Daily Tell a Different Story: Three Waves, Not Five
When you zoom out to the 4-hour chart, something changes. The structure from the October 2025 high of $125,000 to current levels does not look like an impulse down. It looks like a three-wave correction. A-B-C. And that distinction matters more than anything else in this analysis.
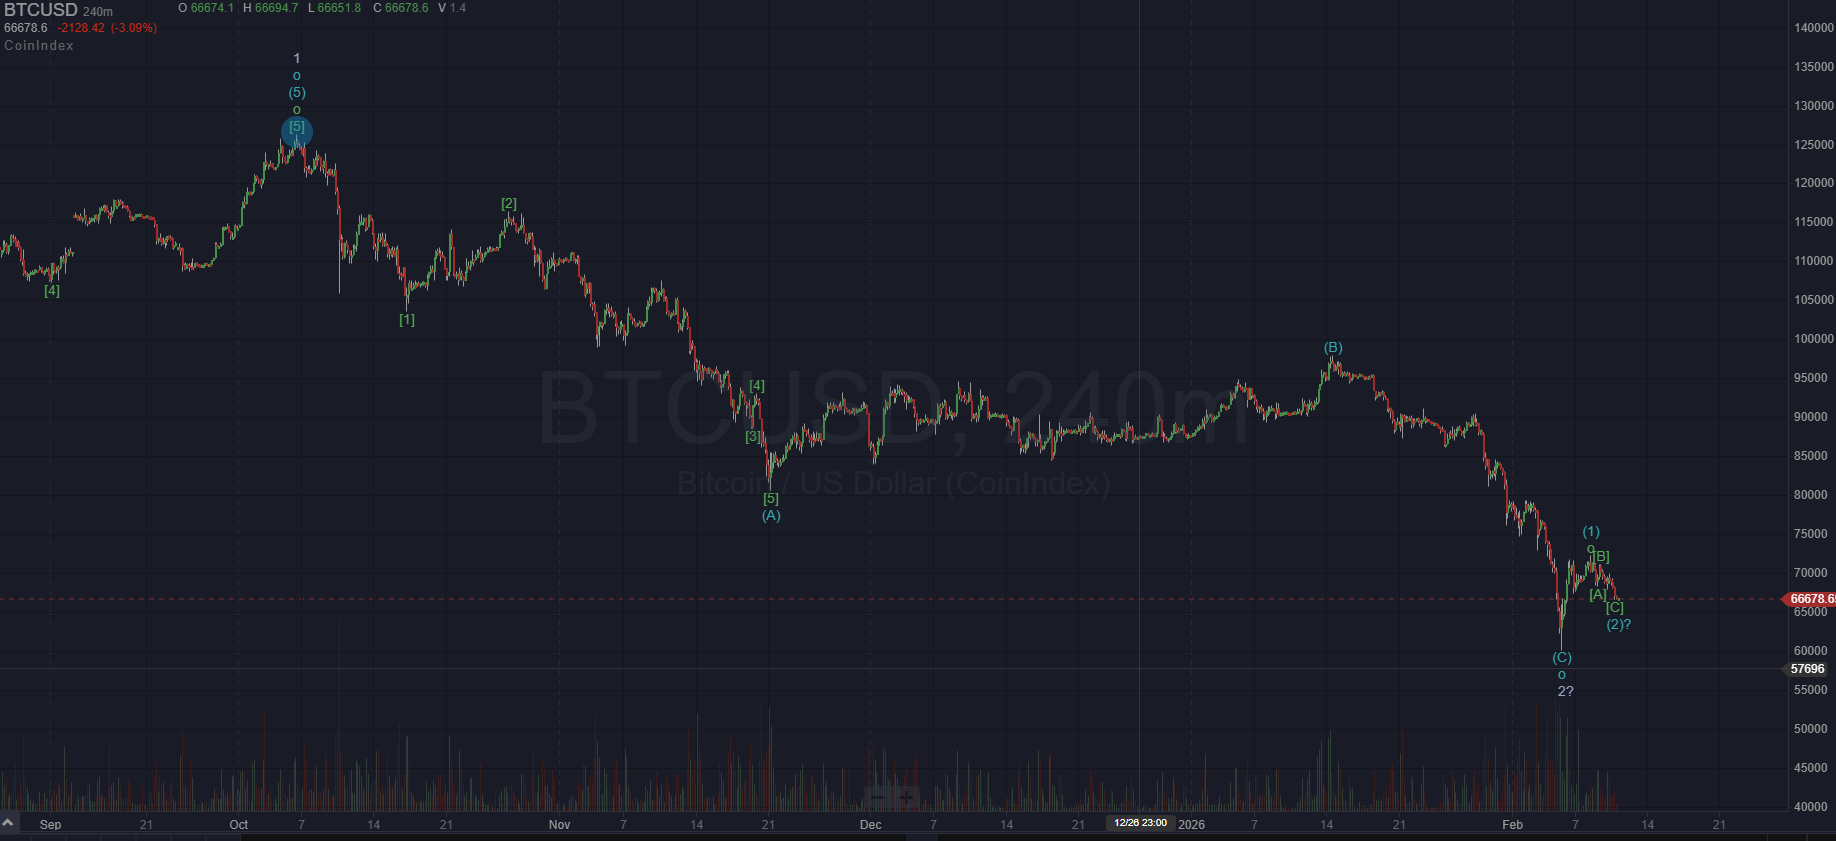
The key observation is wave 2 and wave 4 asymmetry. In a proper five-wave impulse, waves 2 and 4 should alternate in character. One is simple, one is complex. But they should not have extreme time disparities.
When I tried to force a five-wave count on the decline from $125k, wave 2 was extremely compressed in time compared to wave 4. That asymmetry is a red flag. It suggests the labeling is wrong. The structure wants to be A-B-C, not 1-2-3-4-5.
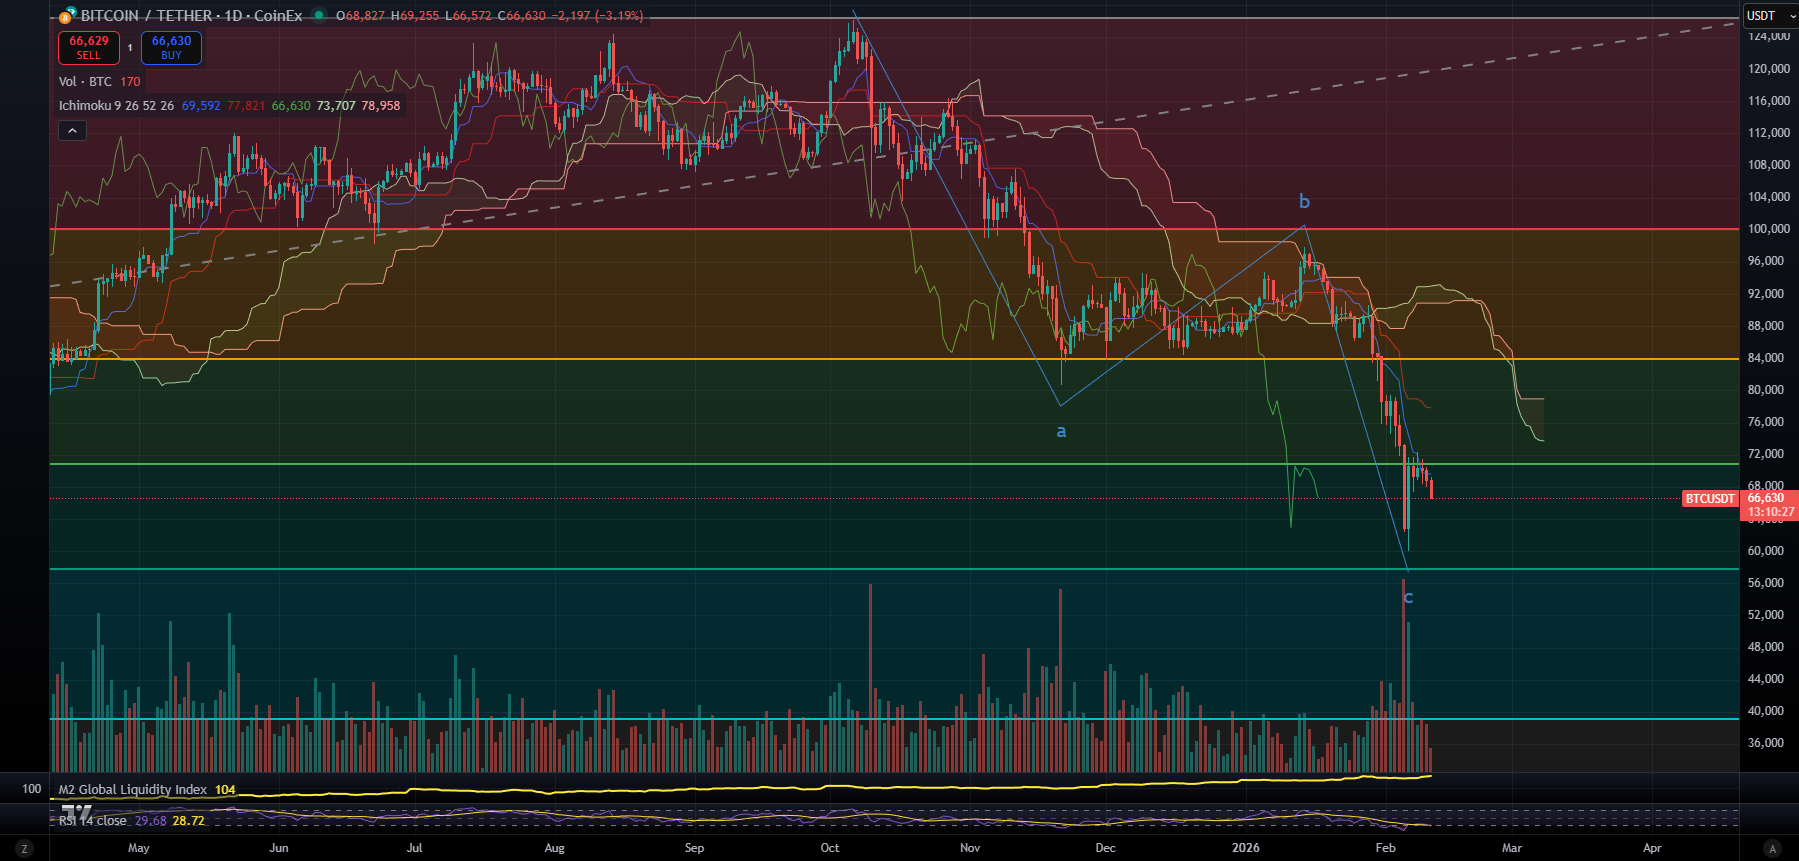
On the daily chart, the A-B-C structure is even cleaner. Wave A ran from approximately $125,000 on October 6, 2025, down to roughly $81,000 around November 21, 2025. Wave B bounced from that low back up to the $97,000–$100,000 range in January 2026. And Wave C is the decline from that B-wave high down to current levels around $66,000–$67,000, projecting toward $57,000–$60,000 at the extreme.
Three waves. Not five. That is the difference between a correction that is ending and an impulse that is just getting started to the downside. And once you see it on the daily, you cannot unsee it.
Time and Price Symmetry: The Strongest Evidence
This is where the analysis gets really interesting. And frankly, this is the evidence that convinced me.
Let me show you the measurements.
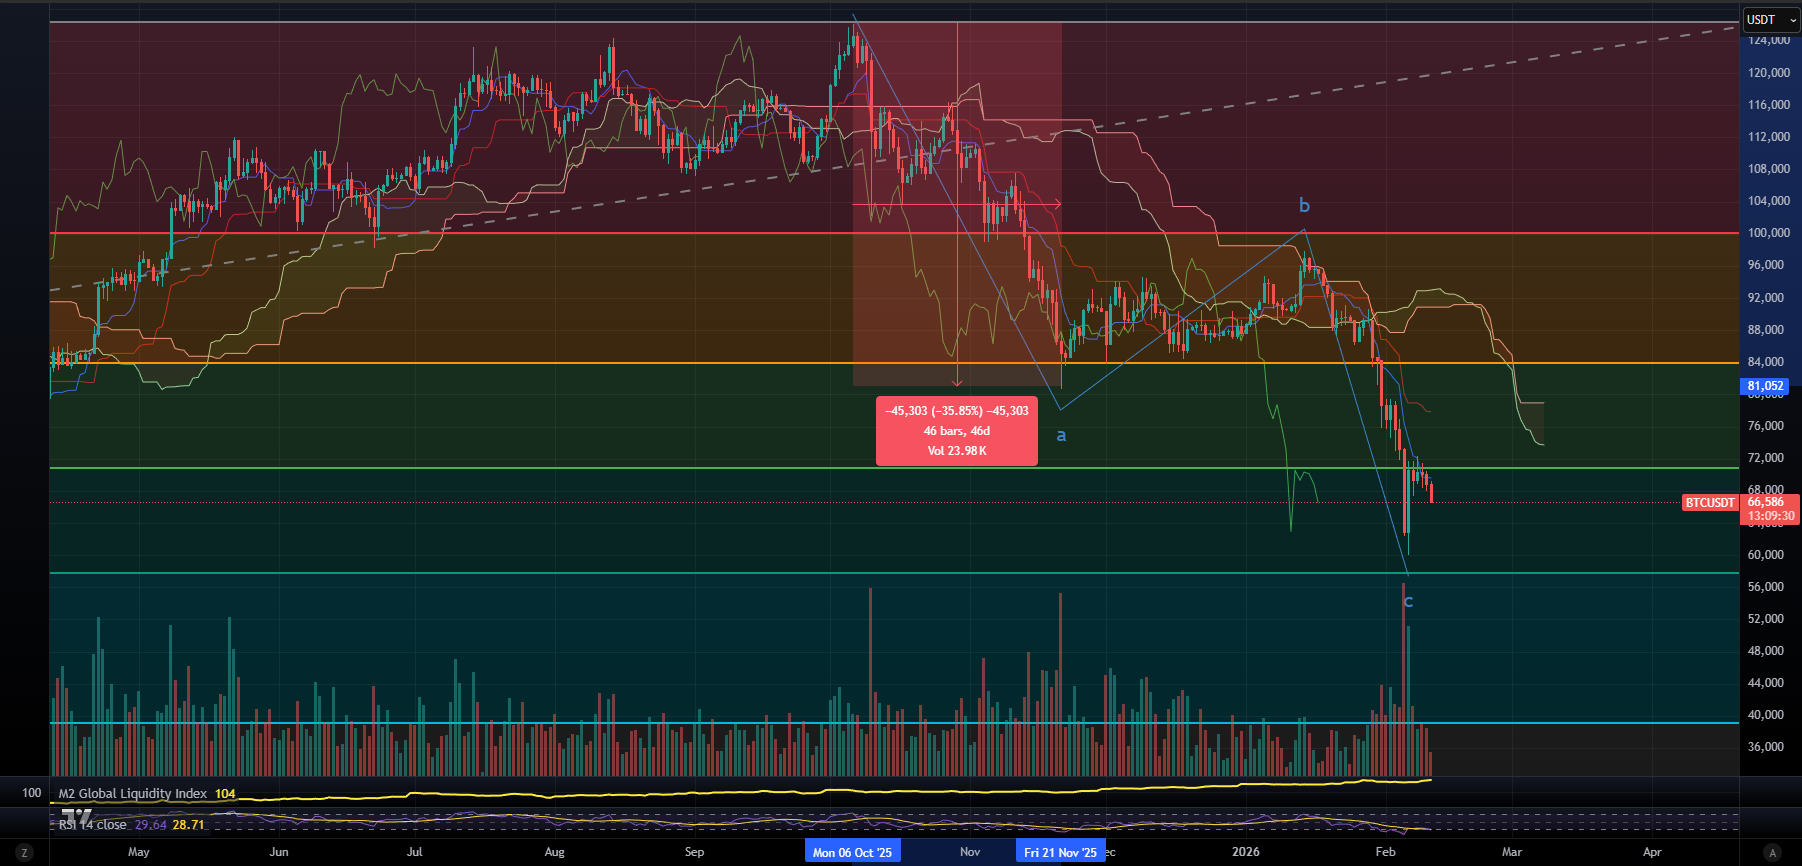
Wave A declined $45,303, or about 35.85 percent, over the course of 46 bars on the daily chart. That is 46 days. The character of this decline was grinding and multi-wave. It took its time.
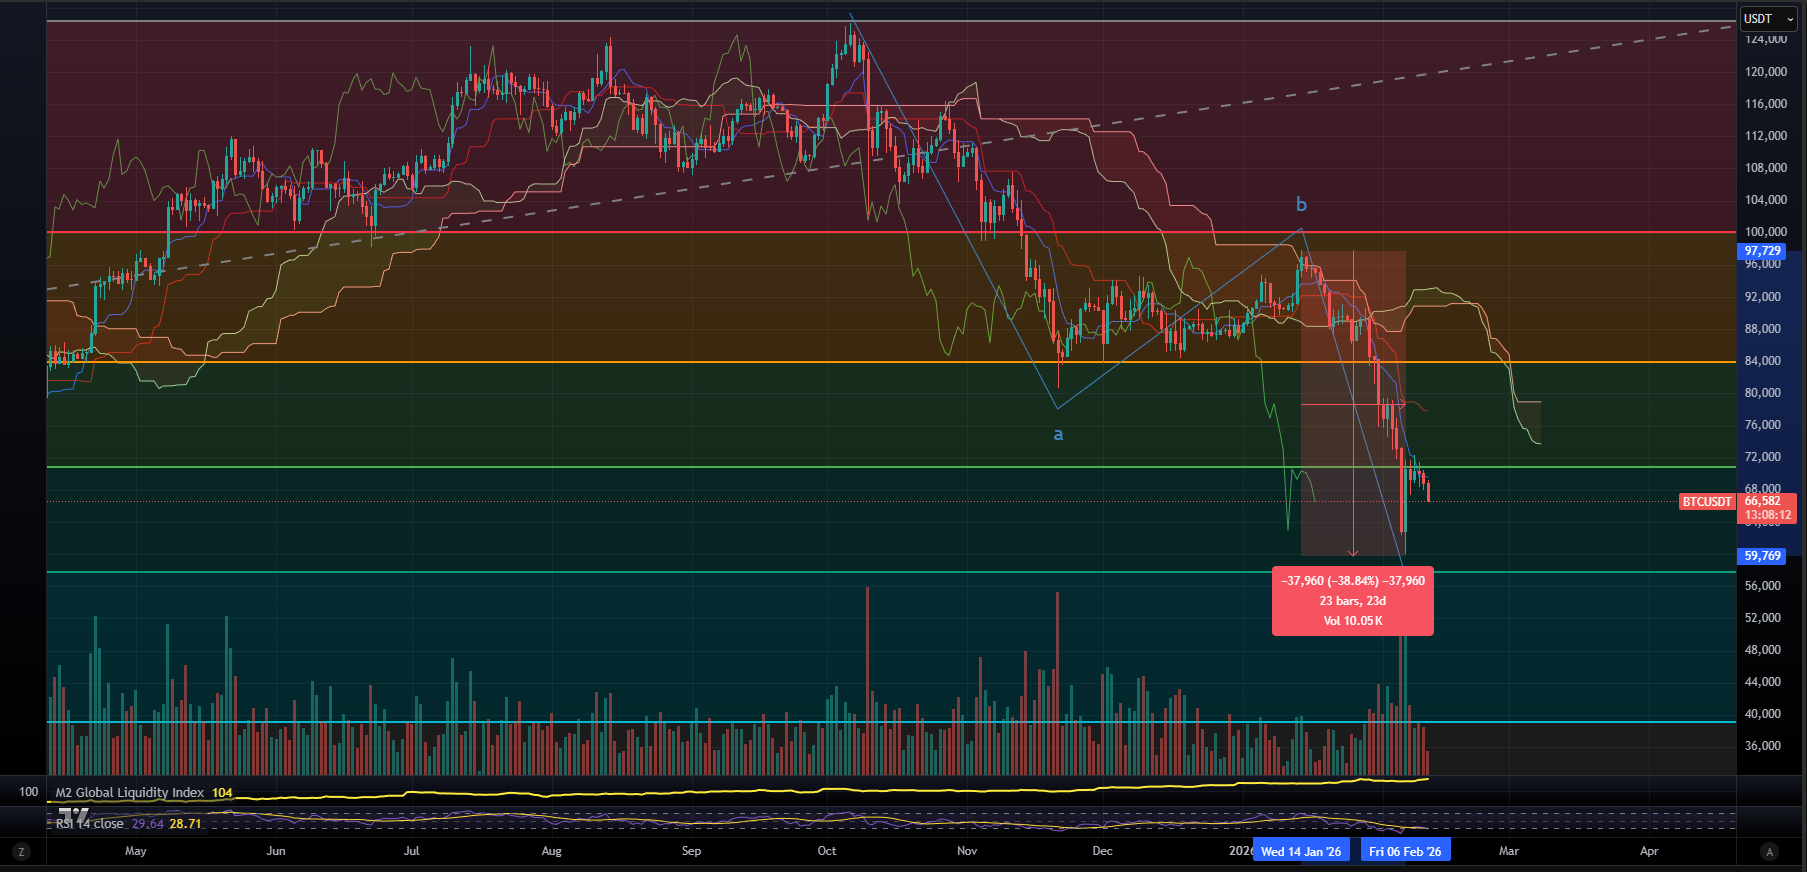
Now look at Wave C. It declined $37,960, or about 38.84 percent, over the course of 23 bars. That is 23 days. Exactly half the time of Wave A. But it achieved a nearly identical percentage decline.
Read that again. Wave C completed in exactly half the time of Wave A but achieved a similar percentage decline.
This is textbook wave C behavior in Elliott Wave Theory. Wave C moves faster than wave A. Wave C travels a similar distance to wave A. Wave C completes in less time. All three conditions are met here, and they are met with almost mathematical precision.
Now ask yourself: if this were wave 3 of a larger impulse down, what would you expect? You would expect the longest and strongest wave. You would expect accelerating momentum, not decelerating. You would expect price to break wave 1’s low with conviction and continue crashing.
That is not what is happening. The decline is slowing, not accelerating. Daily candles are getting smaller. Momentum is waning. This is exhaustion behavior. It is the hallmark of a completing wave C, not an accelerating wave 3.
October 2024 vs. February 2026: Waiting for Time vs. Rushing to Meet Time
This next section is for my Gann heads, but even if you have never studied W.D. Gann, the concept is intuitive once you see it.
One of the most important observations in Gann analysis is how price behaves relative to a key time cycle date. It is not just about whether a date “works.” It is about the character of the move into the date.
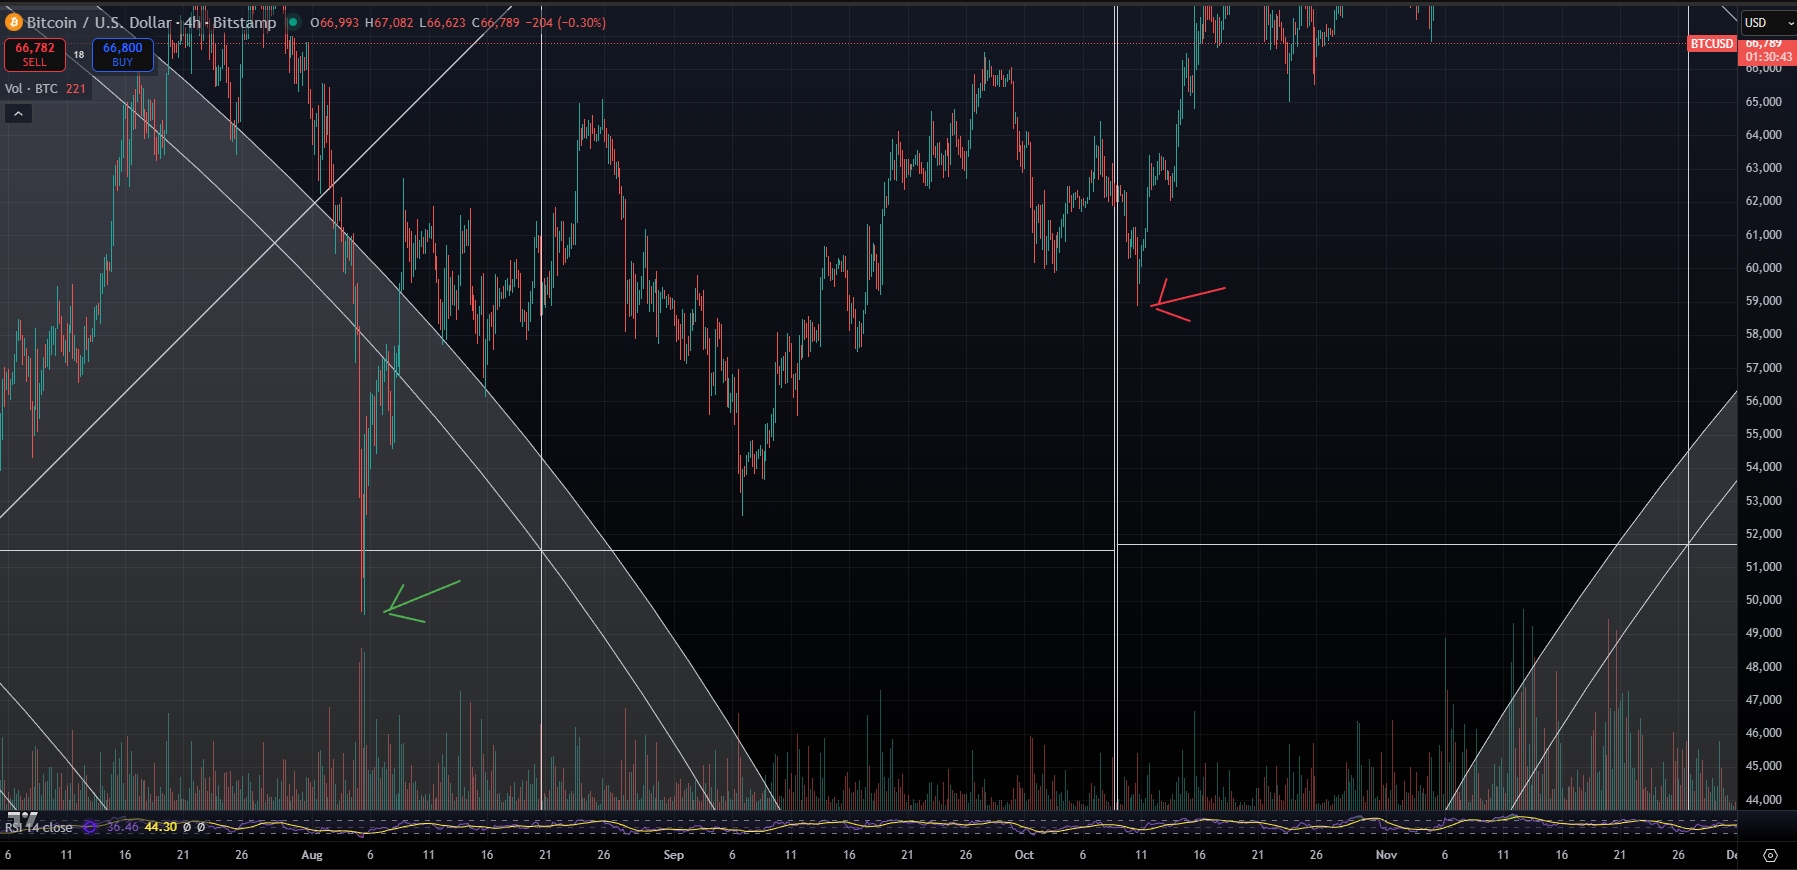
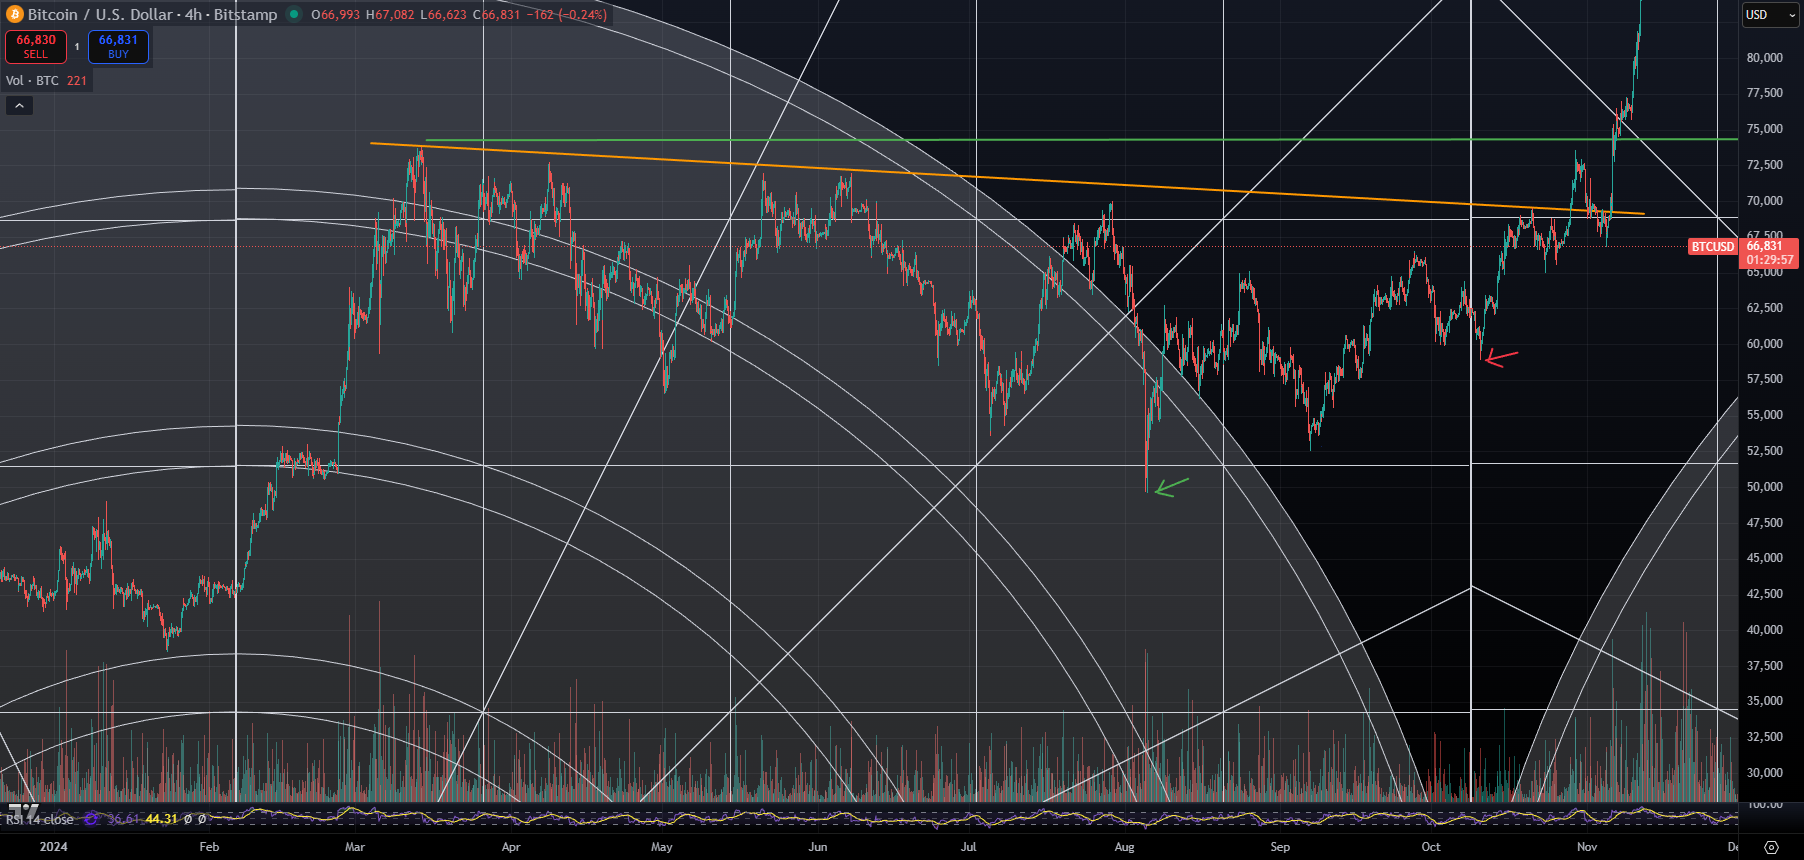
In October 2024, price bottomed well before the Gann date. Bitcoin actually made its low around August 5, 2024. Then it slowly ground higher, making a higher low into the October date. The character was slow, patient consolidation. Price had already done its work. It was waiting for the time cycle to turn. And when it did, Bitcoin launched the rally to $125,000.
In February 2026, the behavior was the opposite. Price was making new lows into the Gann date. The decline was fast and violent — a waterfall — as though price was rushing to reach the target zone by the date. Price was not waiting for time. It was racing to meet it.
This distinction matters because Gann’s concept of “squaring price and time” tells us that the relationship between the two reveals what comes next. In October 2024, the slow grind led to an extended basing period followed by a gradual launch higher. In February 2026, the fast violent decline suggests the opposite: a potential V-bottom or sharp reversal with less basing needed.
Different behavior into the date. Different behavior out of the date.
In my upcoming book “Accelerate Your Money and Prosper,” I lay out how I have been tracking these Gann dates since December 2023. February 6, 2024 worked. October 8, 2024 worked. June 10, 2025 worked. The October–December 2025 sell window worked. Every single one. Now we are at February 10, 2026. The cycle is still running.
Divergences: RSI and M2 Liquidity
The daily RSI sits at 28.71 as I write this. That is capitulation territory. The most oversold reading of the entire decline from $125,000.
But here is what really matters, and it is something the mainstream financial media is completely ignoring. The M2 Global Liquidity Index is at 104 and rising. Rising. While price is falling.
This divergence must resolve. Either liquidity reverses and heads lower — which the macro does not support given that the Fed ended QT on December 1 and started Reserve Management Purchases on December 12 while cutting rates. Or price catches up to liquidity, which is my thesis.
Historically, when price diverges from liquidity, price eventually follows liquidity. Not always immediately. But eventually.
The macro setup right now is the most accommodative it has been since 2021. The Fed is cutting. QT is over. Reserve Management Purchases are active. M2 is expanding. There is a $7.6 to $8 trillion refinancing wall forcing accommodation. And there is a political imperative for economic improvement in Q1 and Q2 ahead of the November 2026 midterms.
Every single one of these factors points in the same direction. As I discussed in “You Are NOT Prepared,” even if Kevin Warsh’s instinct is to tighten, the math and the politics will not let him. Not in 2026.
The Gann Date Convergence: We Are in the Window
Price has now reached the intersection of multiple independent methodologies converging on the same zone at the same time.
- The February 10, 2026 Gann time cycle
- Key Gann arc support, visible in the charts above where the arcs cradle price right in this zone
- The 0.5 to 0.618 Fibonacci retracement zone of the entire wave 1 rally, from about $70,400 down to $57,400
- Maximum time and price symmetry with wave A, as shown in the measurements above
When multiple independent tools all point to the same area at the same time, that is what Gann called the “squaring of price and time.” I do not say this lightly. I have been studying Gann for years. The convergence here is as clean as anything I have seen.
If This Is Wave 3: Price Targets Using Fibonacci Extensions
Now let us talk about where this goes if I am right. Because this is the part that gets exciting. And frankly, it is the part that sounds crazy until you do the math.
If the A-B-C correction is complete — or nearly complete with one more potential push toward $57,000–$60,000 — what comes next is Wave 3 of the larger degree. And potentially Wave 3 of Wave 3, which is the most powerful wave structure in all of Elliott Wave Theory.
Here is the setup:
- Wave 1 of the larger degree ran from approximately $15,000 in October 2022 to $125,000 in October 2025. That is a $110,000 move.
- Wave 2 of the larger degree is the current correction from $125,000 down to the $57,000–$67,000 zone. That represents approximately a 46 to 54 percent retracement — well within normal wave 2 parameters (50 to 61.8 percent).
Wave 3 typically extends 1.618 to 2.618 times the length of wave 1. Using wave 1 = $110,000, measured from a wave 2 low around $60,000:
- Conservative target (1.0 extension): $170,000 — $60,000 + $110,000. The minimum you would typically expect from a third wave.
- Standard target (1.618 extension): $238,000 — $60,000 + $178,000. The classic Fibonacci target. If Bitcoin hits this level, it will be one of the most spectacular rallies in financial market history.
- Extended target (2.618 extension): $348,000 — I include this not because I am predicting it will happen, but because if the ISM hits 60, if liquidity floods the system, if the political accommodation runs through the midterms — this is where the math takes you.
And it gets more interesting. If this is Wave 3 of Wave 3 — meaning the internal structure of the larger wave 3 itself has five sub-waves — the first leg up from the bottom would be wave [1] of 3. After a wave [2] pullback, wave [3] of 3 would be explosive. Using a first leg of approximately $30,000 (say from $60,000 to $90,000):
- A 1.618 extension targets $138,500
- A 2.618 extension targets $168,500
- Then wave [5] of 3 would complete the larger wave 3, potentially reaching the $200,000–$240,000 zone
I know. These numbers sound absurd if you are reading this with Bitcoin at $66,000. But remember, in December 2023 when I was predicting a rally from $50,000 to six figures, that sounded absurd too. And every single Gann date I called in that framework played out.
Time Targets Using Gann Analysis
Price targets without time targets are incomplete. So let me give you the Gann framework for when these moves could happen.
The Gann date sequence has been remarkably consistent:
- February 6, 2024 → October 8, 2024: approximately 8 months
- October 8, 2024 → June 10, 2025: approximately 8 months
- June 10, 2025 → February 10, 2026: approximately 8 months
The rhythm is clear. Using this sequence, the next key Gann dates project forward as follows:
June 2026 (approximately four months from the February 10 low) represents the first major resistance or consolidation zone. If wave 3 launches from here, price could reach $120,000 to $150,000 by June. That would mean recovering the October 2025 high and pushing into new territory.
October 2026 (approximately eight months from the February 10 low) aligns with the length of prior cycle segments. Price could reach $175,000 to $200,000 by this date. This aligns with the ISM potentially reaching the 58–60 territory where Bitcoin has historically made cycle tops.
Late 2026 into early 2027 represents the potential wave 3 completion zone in the $200,000–$250,000 range, followed by a wave 4 correction. And for those of you who have read my book “Protect Your Money and Prosper,” you know I believe that correction, combined with inflation re-emerging and fiscal tightening, sets up the bear market in 2027–2028.
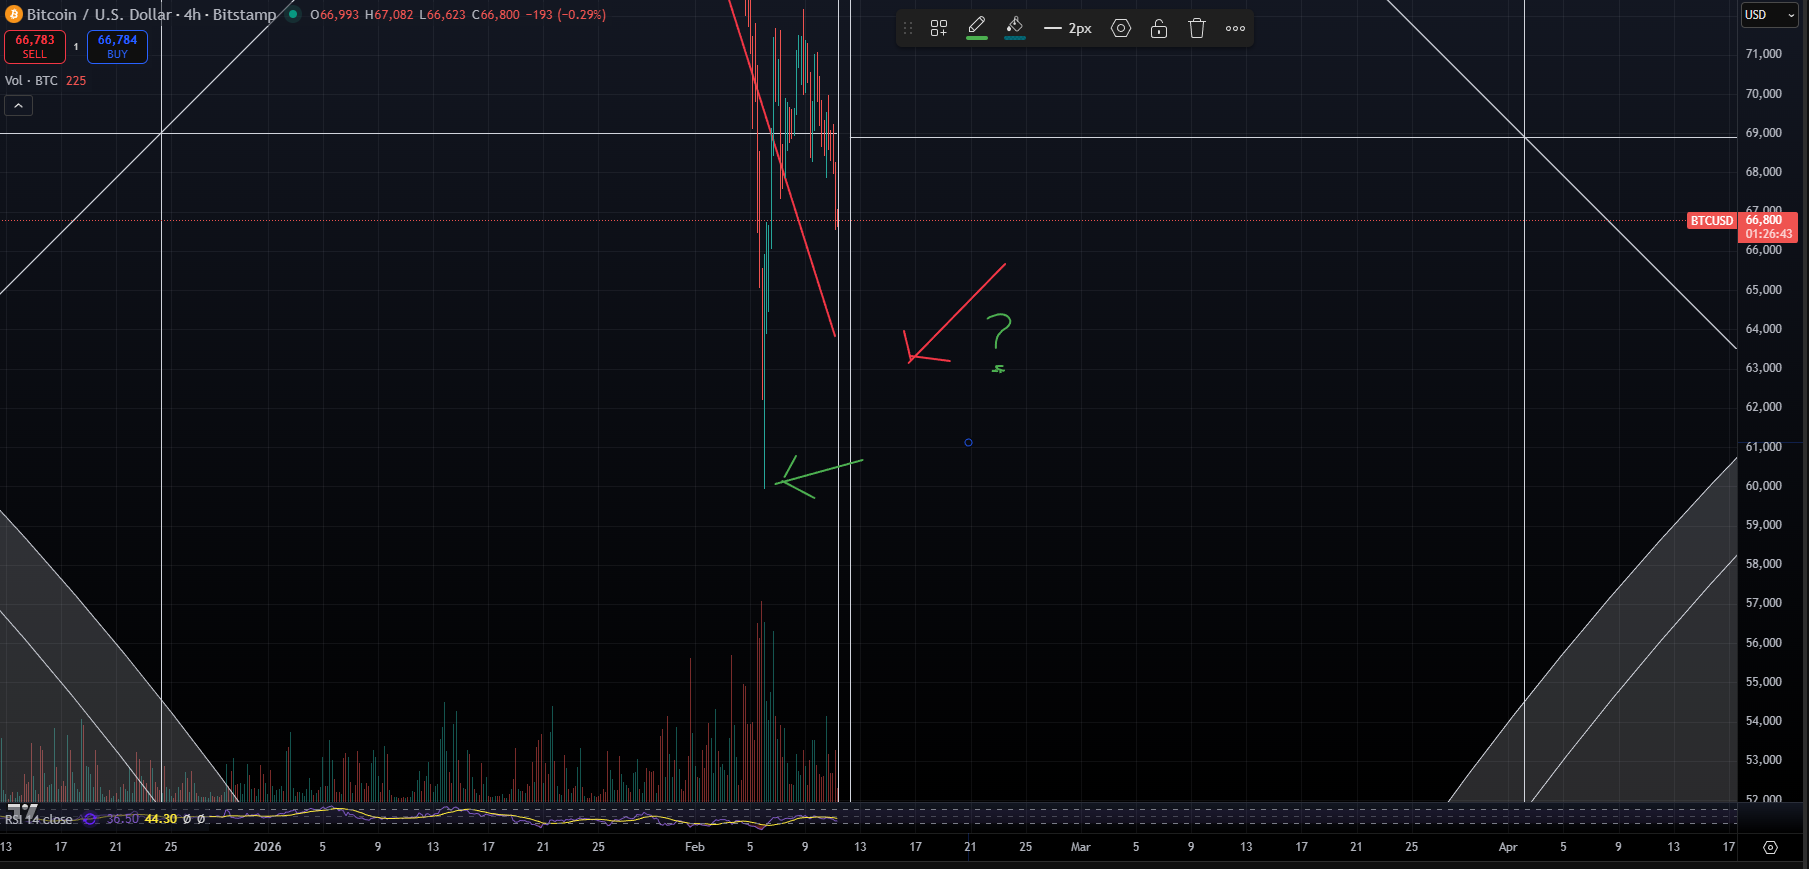
But I am getting ahead of myself. First, let us see if the bounce confirms the thesis.
How I Will Know If I Am Right or Wrong: The Scorecard
I promised you a scorecard in my last article. Here it is.
If the A-B-C is complete and wave 3 is launching:
- The bounce from current levels (or from $57,000–$60,000) will be impulsive — a five-wave structure on the hourly and 4-hour charts
- It will break resistance cleanly at $70,000, then $76,000 (the 0.382 Fibonacci retracement)
- Confirmation comes with a move above $81,000 (the wave A low)
- Strong confirmation comes with a new high above $100,000 within four to six weeks
If I am wrong and this is wave 3 down:
- The bounce will be corrective — three-wave, choppy, overlapping
- It will fail at resistance in the $70,000–$76,000 zone
- Price will roll over and make new lows below $57,000
- Next targets: $52,000–$55,000, then $44,000–$48,000
The character of the bounce tells us everything. We do not have to guess. We just have to watch.
The Convergence: Why I Am Confident
Let me pull all of this together.
First, time and price symmetry. Wave C is exactly half the time of wave A with a similar percentage decline. That is textbook completion behavior for a corrective wave.
Second, the decline is slowing. Momentum is waning. Candles are shrinking. This is exhaustion, not acceleration.
Third, the wave 2 and wave 4 asymmetry on the hourly chart does not hold up when you zoom out to the 4-hour and daily. The structure resolves cleanly as A-B-C on higher timeframes. Trust the higher timeframe. Always.
Fourth, the Gann date convergence. February 10, 2026 marks the intersection of multiple time and price cycles. This is the same methodology that nailed February 2024, October 2024, June 2025, and October–December 2025.
Fifth, the October 2024 vs. February 2026 analog. Different behavior into the Gann date suggests different behavior out of it.
Sixth, the RSI and M2 divergence. A deeply oversold RSI at 28.71 combined with rising M2 liquidity at 104 must resolve. The macro supports resolution higher.
Seventh, the macro setup. Fed cutting, QT ended, Reserve Management Purchases active, a $7.6–$8 trillion refinancing wall, and political imperative for Q1–Q2 improvement ahead of the November 2026 midterms.
Eighth, the Financial Times “Death Knell” indicator. Jemima Kelly published her article on February 8 and appeared on CNBC on February 10 — the exact Gann date — titled “Bitcoin’s death knell sounds.” When the establishment press publishes the obituary, the patient usually starts running marathons.
The Next Two to Three Weeks Will Tell
I have been calling Gann dates since December 2023. February 6, 2024. October 8, 2024. June 10, 2025. October to December 2025. All of them worked. Now we are at February 10, 2026.
The hourly count that “scared even me” was valid on its timeframe. I showed it to you because I believe in radical transparency. I will always show you the charts that argue against me, not just the ones that support me. That is what separates this newsletter from the echo chambers out there that only tell you what you want to hear.
But when I zoomed out, the fear dissolved. The daily and 4-hour charts show a clean A-B-C correction approaching completion. The time and price symmetry is textbook. The divergences are screaming. The macro is aligned.
I could still be wrong. If price breaks decisively below $57,000 and the bounce is corrective, I will need to seriously reconsider. That is the line in the sand. And I will tell you about it honestly if it happens.
But right now, the evidence points one direction: Wave 3 is coming.
And if it is — if this is wave 3 of a larger wave 3 — what comes next could be the most explosive move in Bitcoin‘s history.
$170,000 is the conservative target. $238,000 is the standard target. And if everything aligns — if the ISM hits 60, if liquidity floods the system, if the political accommodation runs through the midterms — we could see prices that sound absurd sitting here today.
The next two to three weeks will put the score on the board.
Watch the character of the bounce. It will tell you everything you need to know.
If you want to understand the full framework behind these Gann dates, the cycle theory, and how I have been tracking Bitcoin’s moves since 2022, it is all in my upcoming book “Accelerate Your Money and Prosper.” And if you want to understand the bigger picture — the secular bull market in hard assets, why the dollar is weakening, and how to position for what I believe is coming in the 2030s — that is in “Protect Your Money and Prosper.” Both are available at coast2coastfinancial.com.
Want more insights like this? Subscribe to the CPA Gone Mad Newsletter for free updates. I send out updates when the charts move, not on a schedule. The next few weeks could be some of the most important of this entire cycle. Make sure you are seeing them in real time.
Disclaimer: Not financial advice, educational purposes only. The views expressed in this article are my personal opinions based on my own research and analysis. I am not a registered financial advisor. Nothing in this article should be construed as a recommendation to buy, sell, or hold any asset. Do your own research and consult with a qualified financial professional before making any investment decisions.